Topology
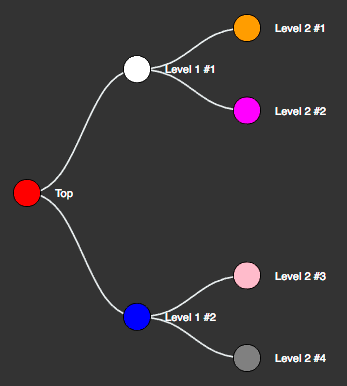
The topology component enables you to display a parent/child hierarchy in a left-to-right rendering, as shown in the following screen shot.
The following figure shows the table containing the data for the topology shown above.
To implement this example:
- Add a topology component to the stage.
- Edit its dataflow to add a table specifying the hierarchy as shown above.
- Bind the Topology data from the dataflow table as shown in the first table.
- Type-in the Topology properties from the dataflow table as shown in the second table.
| Property Name | Bound From | Description |
|---|---|---|
| Data | The entire table in dataflow. | Specifies the node hierarchy and display settings. |
| Property Name | Description |
|---|---|
| Id Field | Name of table column containing unique ID of the node. |
| Parent Field | Name of table column containing gate ID of the parent of the node. Blank if top-level node. |
| Name Field | Name of table column containing the name to display next to the node. |
| Color Field | Name of table column containing the color of the node. |
By default, the topology component displays nodes as small circles. You can create a symbol to be displayed for nodes; for example:
- In the Outline, select the stage and, using the ellipse tool, create a circle and convert it to a symbol called, for example, "node".
- In the Symbols pane, select the node symbol and choose Modify > Edit Properties. Add a string parameter named "color" and bind it to the symbol's Fill property.
- Now set the topology's Symbol property to "node". If you have configured the bindings correctly, the parent 'renderer' node is displayed.
- Select topology widget and open data table to view table driving your topology. Keep it open for next steps.
- Select renderer to see properties of your new node symbol (color and any others if you had created them).
- From your open data table, grab header of the column that contains color code (either worded or hex) and drag that column by the header onto color property of the renderer.
You're done. Performing this last step creates a binding that will now use appropriate column of your data table to supply a color value to each instance of 'node' symbol in your topology.

