Tables
One purpose of dataflow is to work with tables. Tables are used by charts, data grids, repeaters, and other DGLux5 components and widgets. This page covers:
- How to load a table
- How to perform operations on a table
- How to create a table in real time
- How to get a string that aggregates column values
- How to view the contents of nested tables
- How to unbind and save table data
Note
Dataflow does not support duplicate column names within a table. In particular, the Column Mapping block and the Filter block do not support duplicate column names.
How to Load a Table
To load a table, first open the dataflow model or the Project Dataflow. Then, follow the relevant procedure below.
Tip
If you want to use this table as the source for a component, you might want to insert the component first. Then, you can insert the table in the component's dataflow model.
How to Load a Table from a Metric History
To load a table from a metric history:
Without closing the dataflow window, open the Data panel, and select the relevant node.
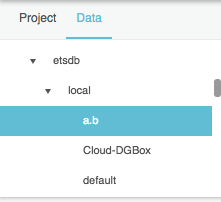
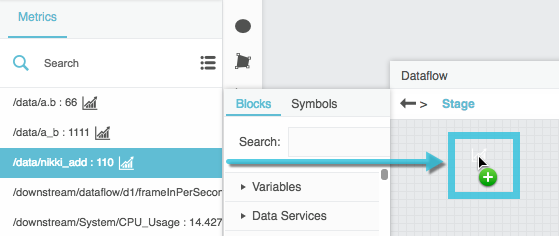
In the Metrics panel, find the relevant data metric, and drag its
 History icon to the dataflow window.
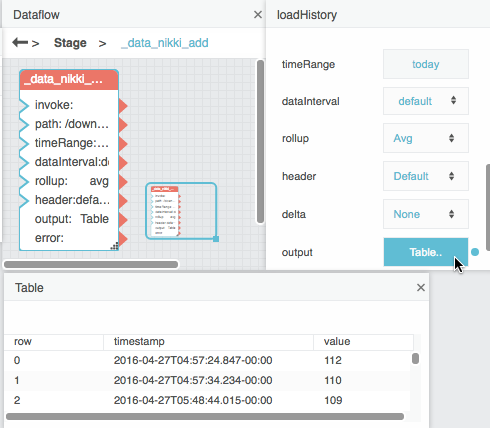
To open the table, select the Load History dataflow block, and in the block properties panel, click the value of the output property.
How to Load a Table from Multiple Metric Histories
To load one table from multiple data metric histories:
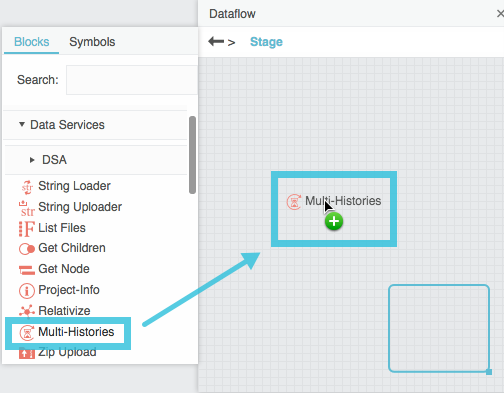
In the dataflow window, expand Data Services, and drag a Multi-Histories block to the dataflow.
- Select the Multi-Histories block.
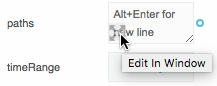
Click the
 Edit in Window icon in the paths field.
A pop-up appears.
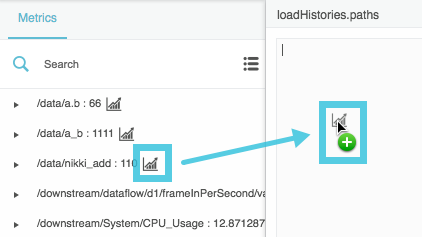
In the Data panel, select the relevant data source.
In the Metrics panel, select a relevant data metric, and drag its
History icon to the pop-up.
- After the path, type Enter to insert a new line.
- Repeat steps 4 to 6 until all of the relevant data metrics are loaded, and then click Apply or OK.
With the Multi-Histories block selected, click Invoke.
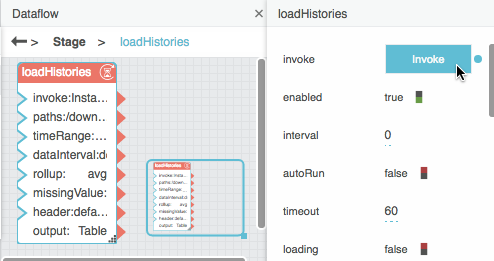
With the Multi-Histories block selected, click the value of the output property to open the table.

How to Parse a Table from CSV or JSON Data
Before loading a table from a CSV or JSON file, you might want to upload the file to your project.
To load a CSV or JSON string and then parse it into a table:
In the block palette, expand Data Services, and drag a String Loader block onto the dataflow window.
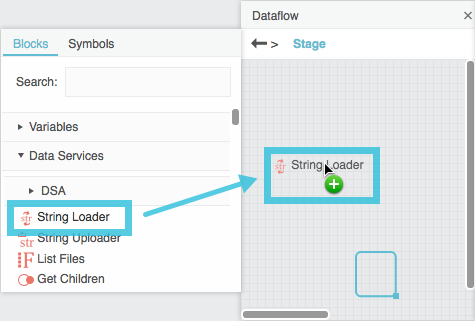
- Select the String Loader block.
In the Project panel, find the JSON or CSV file in your DGLux5 project, drag it to the path property of the String Loader block, and press Enter or Return.
Note
You can also enter an absolute URL as the path property.
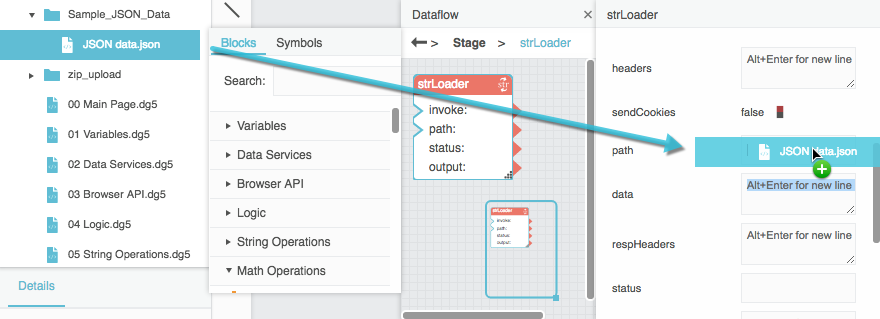
The CSV or JSON string appears as the output property.

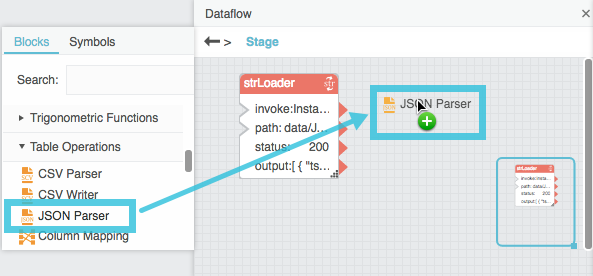
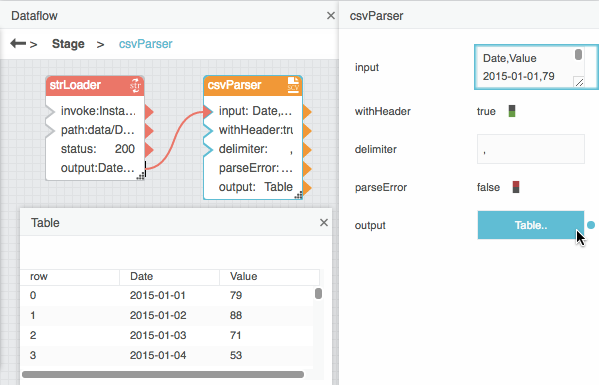
Expand Table Operations, and drag a CSV Parser or JSON Parser block onto the dataflow window.
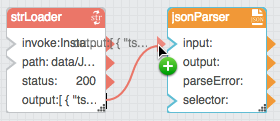
Bind the output property of the String Loader block to the input property of the CSV Parser or JSON Parser block.
If your file is a CSV file that includes headers, select the CSV Parser block and set the withHeader property to TRUE.
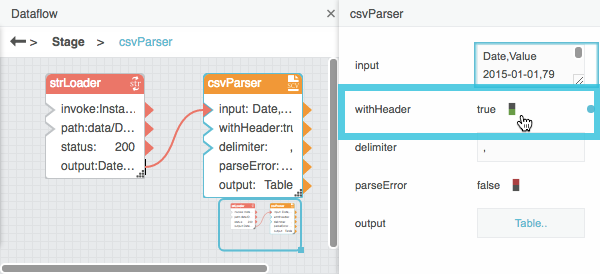
Select the CSV Parser or JSON Parser block, and then click the value of the output property to open the table.
Tip
You can also load JSON data from a web source using the JSONP Loader block.
How to Manually Enter Data in a Table Dataflow Block
To add a Table block and manually enter table data:
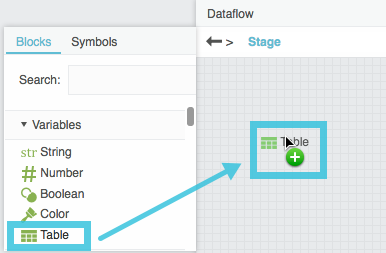
Expand Variables, and drag a Table dataflow block onto the dataflow window.
Select the Table block, and click the value of the data property to view the sample data.
Enter your own data, as described in How to Manually Edit Values in a Table Block
How to Perform Operations on a Table
You can use dataflow to perform an operation on a table and return the result as a new table.
How to Create Calculated or Formatted Values
To create a new column that contains calculated or formatted values:
- If the source data comes from multiple tables, use one or more Join blocks to create a unified table.
- Add a Column Mapping block to the dataflow model.
- Bind the input table to the input property of the Column Mapping block.
- Specify the new column name, as the name 0 property.
Specify the calculated or formatted value, as the from 0 property. Use JavaScript notation. For JavaScript examples, see Column Mapping.
The output table appears as the output property of the Column Mapping block.
- To create additional columns, click the plus sign (+) to add name n and from n values to the block. Then, repeat steps 4 and 5.
See also Column Mapping.
How to Sort Values Alphabetically or Numerically
To sort table rows in alphabetical or numerical order:
- Add a Sort block to the dataflow model.
- Bind the input table to the input property of the Sort block.
- With the Sort block selected, specify the following in the block properties panel:
- The column name from the input table, as the column property
- The sort method (alphabetical or numerical), as the method property
The sort order (ascending or descending), as the order property
The output table appears as the output property of the Sort block.
Tip
You can also use a Select Rows block to manually set the row order.
See also Sort.
How to Filter Rows from a Table
To filter rows from your data:
- Add a Filter block to the dataflow model.
- Bind the input table to the input property of the Filter block.
- Write a condition using JavaScript notation, and specify this condition as the condition property. For condition examples, see Filter.
The output table appears as the output property of the Filter block.
Tips
- You can also use a Select Rows block to manually exclude rows.
- To restrict data to a date and time range, you can also use the timeRange property of a Load History or Multi-Histories block.
See also Filter.
How to Group Rows
To ensure that only one row appears in the table for each unique value:
- Add a Group By block to the dataflow model.
- Bind the input table to the input property of the Group By block.
- With the Group By block selected, specify the following in the block properties panel:
- The column on which grouping is determined, as the baseColumn property.
- Other columns to include in the output, as column n properties.
- The grouping method for each column, as method n properties. For descriptions, see Group By.
The name of each column in the output table, as outColumn n properties.
The output table appears as the output property of the Group By block.
Tip
To combine rows based on date and time intervals instead of duplicate values, you can either use a Rollup block or use the dataInterval and rollup properties of a Load History or Multi-Histories block.
See also Group By.
How to Join Tables
To perform a join operation that combines two input tables:
- Add a Join block to the dataflow model.
- Bind the left input table to the input1 property of the Join block.
- Bind the right input table to the input2 property of the Join block.
- With the Join block selected, specify the following in the block properties panel:
- The key column in the left input table, as the column1 property.
- The key column in the right input table, as the column2 property.
The join method to use, as the join property. For descriptions, see Join.
The output table appears as the output property of the Join block.
See also Join.
How to Break a Table into Pages
To break up your data into sequential sections:
- Add a Page block to the dataflow model.
- Bind the input table to the input property of the Page block.
- With the Page block selected, specify the following in the block properties panel:
- The number of rows per page, as the pageSize property.
The row index on which the current page begins, as the start property.
The table portion appears as the output property of the Page block.
See also Page.
Tip
If you want, you can bind buttons to the Page block's next and previous triggers, allowing the user to page through the data. For more information about creating buttons, see Actions.
How to Roll Up Date and Time Values
To ensure that only one row appears for each date and time interval:
- Add a Rollup block to the dataflow model.
- Bind the input table to the input property of the Rollup block.
- With the Rollup block selected, specify the following in the block properties panel:
- The length of the interval.
- The input table column that holds dates, as the dateColumn property.
- The input table column that holds values, as the valueColumn property.
The type of rollup to use, as the valueRollup property. For descriptions, see Rollup.
The output table appears as the output property of the Rollup block.
Tip
You can also use the dataInterval and rollup properties of a Load History or Multi-Histories block.
See also Rollup.
How to Select Certain Rows
To manually include only certain rows:
- Add a Select Rows block to the dataflow model.
- Bind the input table to the input property of the Select Rows block.
With the Select Rows block selected, specify which row indexes to include, as a list of comma-separated numbers.
The output table appears as the output property of the Select Rows block.
Tip
You can also use a Select Rows block to manually set the row order.
See also Select Rows.
How to Transpose a Table
To transpose an input table, so that the columns in the input table become the rows in the output table:
- Add a Transpose block to the dataflow model.
Bind the input table to the input property of the Transpose block.
The output table appears as the output property of the Transpose block.
See also Transpose.
How to Create a Table in Real Time
To monitor changes to specified values and create a table that records values as they change:
- Add a Realtime Recorder block to the dataflow model.
- Bind the value that you want to monitor to the value 0 property.
- Specify the name of the value, as the name 0 property.
To monitor additional values, click the plus sign (+) to add name n and value n values to the block. Then, repeat steps 2 and 3.
The output table appears as the output property of the Realtime Recorder block. This table updates when the values change.
Note
Realtime Recorder table contents are saved only in the current session.
See also Realtime Recorder.
How to Get a String that Aggregates Column Values
To get a string that reflects the table records in a column:
- Add an Aggregation block to the dataflow mode.
- Bind the input table to the input property of the Aggregation block.
- With the Aggregation block selected, specify the following:
- The column to aggregate, as the column property.
The method of aggregation, as the method property. For descriptions, see Aggregation.
The string appears as the output property of the Aggregation block.
See also Aggregation.
How to View the Contents of Nested Tables
Nested tables occur whenever a table stores other tables.
To view a table that is in another table:
- Add a Table block to the dataflow model.
Drag the cell that contains a table, and drop the cell on the Table block.
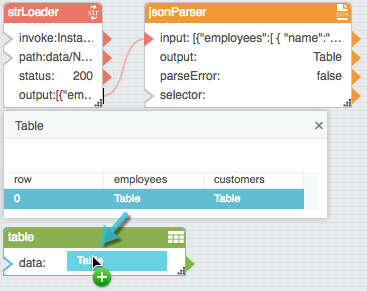
This creates a binding from the table in the cell to the Table block. You can view the table data by clicking the value of the Table block’s data property.
How to Unbind and Save Table Data
Sometimes, you might want to unbind a table and also preserve the data that it currently holds. For example, you might want to share a dataflow model with a colleague who does not have access to your data server.
To unbind a table and preserve its data:
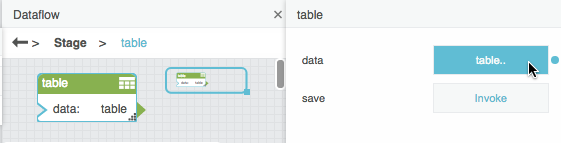
- Make sure that the data you are using is bound to a Table block.
With the Table block selected, invoke the save property.
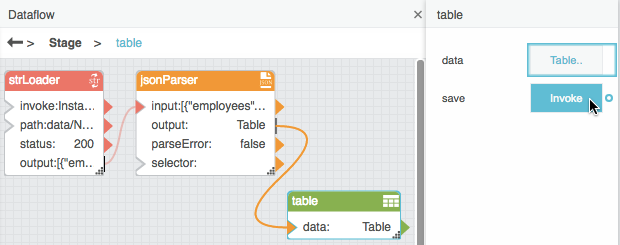
The binding to the data property is destroyed, and the data is saved in the Table block.
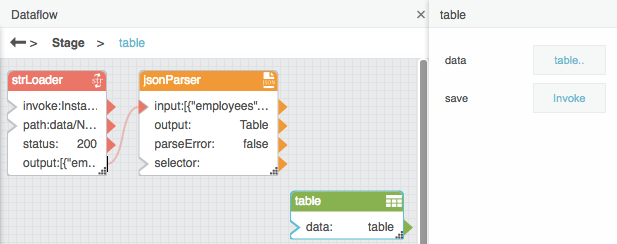
Table Operations FAQ
This section provides answers to some common questions about manipulating tables in DGLux5. These answers might be helpful when you work with charts and data grids.