Rollup
![]() The Rollup Widget allows you to transform a table of historical data by rolling up rows of data based on timestamp.
The Rollup Widget allows you to transform a table of historical data by rolling up rows of data based on timestamp.
Workflows
The Standard Workflow for applying a Rollup Widget is to first define the source data table. Next, define the date range to use (effectively trimming excess data from your input table), as well as the interval to roll up on. Under the Columns Accordion, you will need to define which column is the date field, and which columns will be rolled up (and how). Once you are satisfied with the data set, you are ready to apply the data to the rest of your dashboard by binding the table to a repeater or chart.
Properties
| Preview | Property | Description |
|---|---|---|
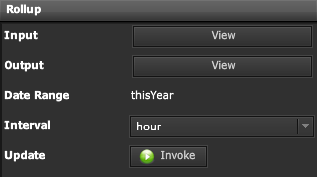
 | Input | Table of Data to perform Rollup function on |
| Output | Table of Data based on Column Conditions | |
| Date Range | Specify Date Range to use for Rollup function | |
| Interval | Specify Data Interval to Rollup to | |
| Update | When Invoked, will Update the widget and Output Table | |
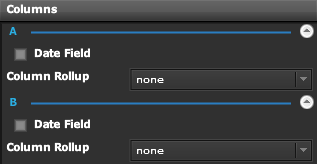
 | Column Name | A Group will be created for each Column from Input Table |
| Date Field | When Enabled, will denote that the column is a Timestamp, and should be used for Rollup function | |
| Column Rollup | none, min, max, avg, sum |
Demo
Sample Video of Widget in Use