Table of Contents
Plot Area Properties
These properties affect the plot area and zooming for a chart. In the Property Inspector they appear in the Plot Area and Zooming sections.
For a guide to using charts, see Designing Charts.
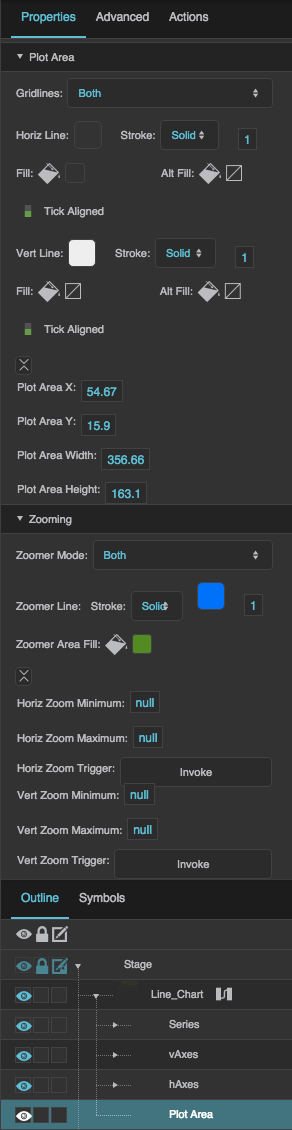
General Plot Area properties and Zooming properties in the Property Inspector
General Plot Area Properties
These properties affect the appearance of a plot area.
Gridlines
Gridlines
Gridlines
Defines which gridlines are displayed in the plotting area of the chart. You can choose None, Horizontal, Vertical, or Both. Default is Horizontal.
For radar charts, the Radar Line properties are shown instead of the horizontal and vertical gridline properties.
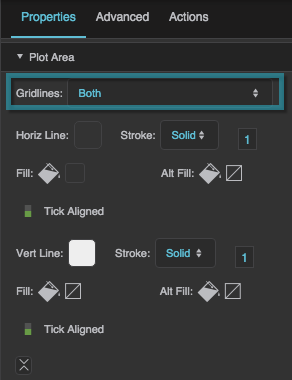
The Gridlines property
Horizontal Stroke Color
Horizontal Stroke Color
Horiz Line (Horizontal Stroke Color)
Defines the stroke color for horizontal gridlines.
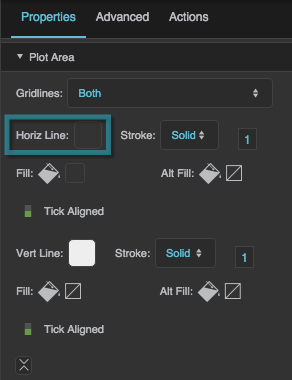
The Horizontal Stroke Color property
Horizontal Stroke Style
Horizontal Stroke Style
Horizontal Stroke Style
Defines the stroke style for horizontal gridlines.
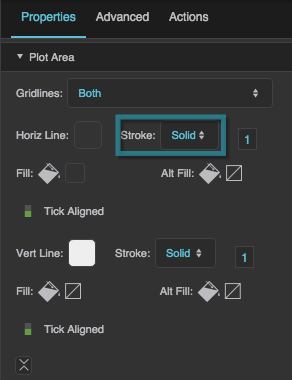
The Horizontal Stroke Style property
Horizontal Stroke Weight
Horizontal Stroke Weight
Horizontal Stroke Weight
Defines the stroke weight for horizontal gridlines.
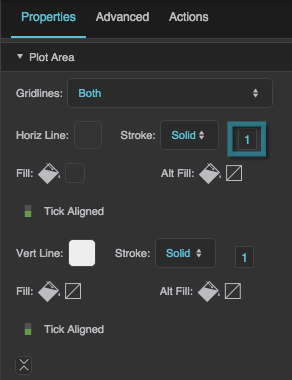
The Horizontal Stroke Weight property
Horizontal Fill
Horizontal Fill
Fill (Horizontal Fill)
Defines the first of two fills that alternate in the plotting area between horizontal gridlines.
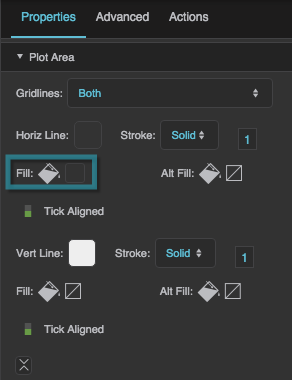
The Horizontal Fill property
Horizontal Alternate Fill
Horizontal Alternate Fill
Alt Fill (Horizontal Alternate Fill)
Defines the second of two fills that alternate in the plotting area between horizontal gridlines.
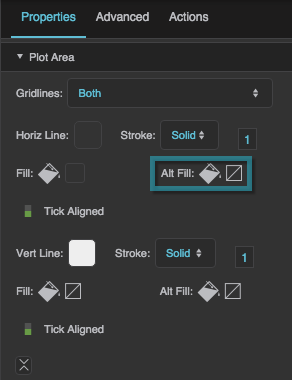
The Horizontal Alternate Fill property
Horizontal Tick Aligned
Horizontal Tick Aligned
Tick Aligned (horizontal gridlines)
Specifies whether horizontal gridlines are aligned to the major ticks of the vertical axis. Default is TRUE.
Vertical Stroke Color
Vertical Stroke Color
Vert Line (Vertical Stroke Color)
Defines the stroke color for vertical gridlines.
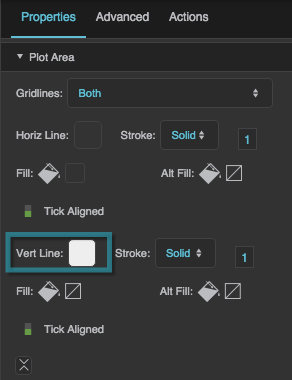
The Vertical Stroke Color property
Vertical Stroke Style
Vertical Stroke Style
Vertical Stroke Style
Defines the stroke style for vertical gridlines.
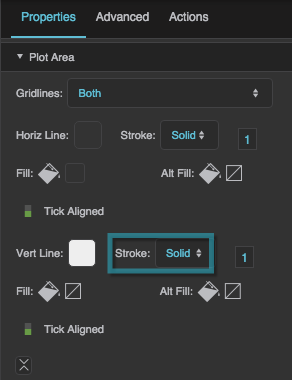
The Vertical Stroke Style property
Vertical Stroke Weight
Vertical Stroke Weight
Vertical Stroke Weight
Defines the stroke weight for vertical gridlines.
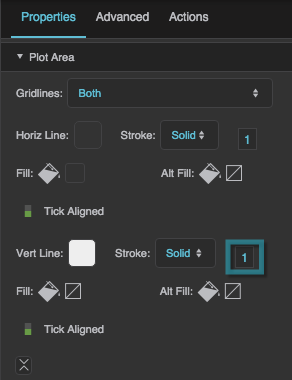
The Vertical Stroke Weight property
Vertical Fill
Vertical Fill
Fill (Vertical Fill)
Defines the first of two fills that alternate in the plotting area between vertical gridlines.
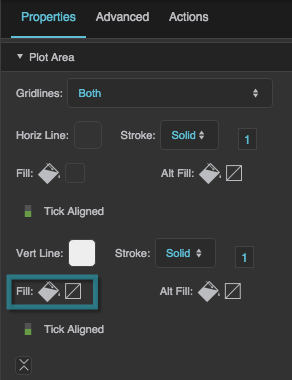
The Vertical Fill property
Vertical Alternate Fill
Vertical Alternate Fill
Alt Fill (Vertical Alternate Fill)
Defines the second of two fills that alternate in the plotting area between vertical gridlines.
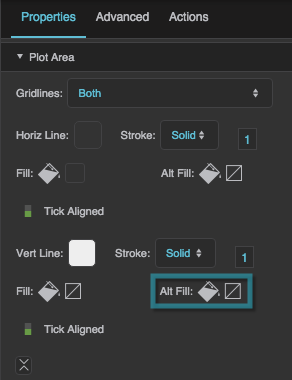
The Vertical Alternate Fill property
Vertical Tick Aligned
Vertical Tick Aligned
Tick Aligned (vertical gridlines)
Specifies whether vertical gridlines are aligned to the major ticks of the horizontal axis. Default is TRUE.
Radar Gridlines
Radar Gridlines
Radar Line Form
For radar charts, defines the shape of the gridlines: Line (polygon) or Arc (circle). Default is Line.
Radar Line, Stroke
The color, style, and weight of the radar gridlines.
Fill and Alt Fill
Two fills that alternate between radar gridlines.
Fills Table and Table Column
Optionally, a table and the name of one of its columns that lists the fills to use between radar gridlines, instead of Fill and Alt Fill.
Plot Area X
Plot Area X
Plot Area X
Returns the view x-coordinate at the left edge of the plotted area. This is a read-only property, so changing it manually does nothing.
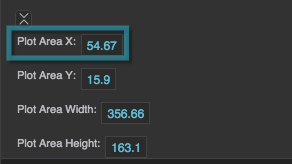
The Plot Area X property
Plot Area Y
Plot Area Y
Plot Area Y
Returns the view y-coordinate at the top edge of the plotted area. This is a read-only property, so changing it manually does nothing.
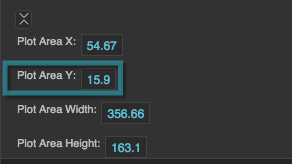
The Plot Area Y property
Plot Area Width
Plot Area Width
Plot Area Width
Returns the width of the plot area in pixels. This is a read-only property, so changing it manually does nothing.
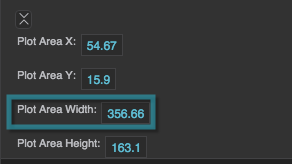
The Plot Area Width property
Plot Area Height
Plot Area Height
Plot Area Height
Returns the height of the plot area in pixels. This is a read-only property, so changing it manually does nothing.
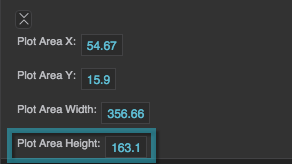
The Plot Area Height property
The following properties are in the Advanced part of the Plot Area section, together with Plot Area X, Y, Width, and Height.
Clip Content
Clip Content
Clip Content
Specifies whether series content is clipped to the plot area. Default is TRUE.
Vertical Axes and Horizontal Axes
Vertical Axes and Horizontal Axes
Vertical Axes / Horizontal Axes
Comma-separated list of axis indices (for example 0,1) that the gridlines are drawn for. If empty, the default axis is used.
Zooming Properties
These properties affect the chart's zooming behavior. Zooming does not work on a category axis. For more information, see How do I zoom a chart?
Zoomer Mode
Zoomer Mode
Zoomer Mode
Sets or returns the Zoomer Mode of the chart. Zoomer Modes allow the user to zoom in by dragging a marquee, and zoom out by clicking on the chart. Zoomer Modes work only with linear, log, and datetime axes. When any Zoomer Mode is enabled, both horizontal and vertical ranges can also be defined in the Property Inspector.
None
No zooming is enabled.
Horizontal
The user can zoom in to a specific horizontal range. The user cannot change the vertical zoom by dragging.
Vertical
The user can zoom in to a specific vertical range. The user cannot change the horizontal zoom by dragging.
Both
The user can zoom in to a specific horizontal and vertical range by dragging once in each direction.
Rectangle
The user can zoom in to a specific horizontal and vertical range by dragging a rectangle.
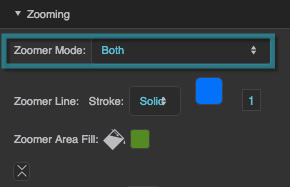
The Zoomer Mode property
Zoomer Stroke Style
Zoomer Stroke Style
Zoomer Line Stroke style
Defines the stroke style for the outline of the zoom marquee.
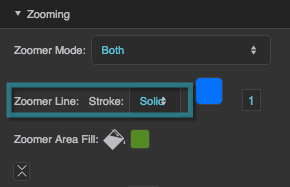
The Zoomer Stroke Style property
Zoomer Stroke Color
Zoomer Stroke Color
Zoomer Line color
Defines the stroke color for the outline of the zoom marquee.
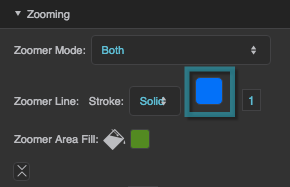
The Zoomer Stroke Color property
Zoomer Stroke Weight
Zoomer Stroke Weight
Zoomer Line stroke weight
Defines the stroke weight for the outline of the zoom marquee.
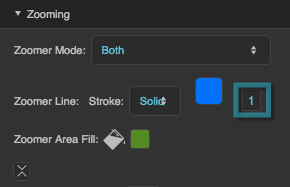
The Zoomer Stroke Weight property
Zoomer Fill
Zoomer Fill
Zoomer Area Fill
Defines the fill of the zoom marquee.
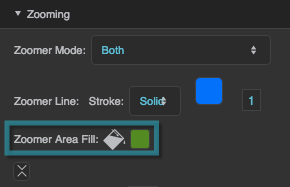
The Zoomer Fill property
Zoom All Axes
Zoom All Axes
Zoom All Axes
If the chart has more than one horizontal or vertical axis, specifies whether zooming applies to all axes. If FALSE, only the first axis in each direction is zoomed. Default is FALSE.
Horizontal Zoom Minimum
Horizontal Zoom Minimum
Horiz Zoom Minimum
Sets or returns the minimum of the range on the horizontal axis for the zoomed view. If either Minimum or Maximum is null, the zoom does not happen.
Zooming works only with linear, log, and datetime axes. For dates, use the format "yyyyMMdd".
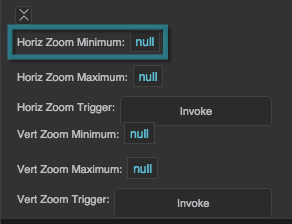
The Horizontal Zoom Minimum property
Horizontal Zoom Maximum
Horizontal Zoom Maximum
Horiz Zoom Maximum
Sets or returns the maximum of the range on the horizontal axis for the zoomed view. If either Minimum or Maximum is null, the zoom does not happen.
Zooming works only with linear, log, and datetime axes. For dates, use the format "yyyyMMdd".
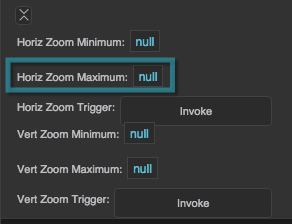
The Horizontal Zoom Maximum property
Horizontal Zoom Trigger
Horizontal Zoom Trigger
Horiz Zoom Trigger
Zooms the chart to the range specified by the Horizontal Zoom Minimum and Maximum. To return the chart to its pre-zoom view, the user can click on the chart. Zooming works only with linear, log, and datetime axes.
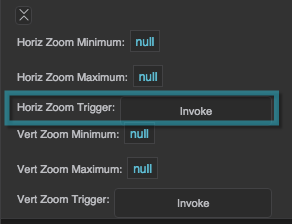
The Horizontal Zoom Trigger property
Vertical Zoom Minimum
Vertical Zoom Minimum
Vert Zoom Minimum
Sets or returns the minimum of the range on the vertical axis for the zoomed view. If either Minimum or Maximum is null, the zoom does not happen.
Zooming works only with linear, log, and datetime axes. For dates, use the format "yyyyMMdd".
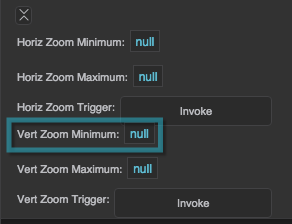
The Vertical Zoom Minimum property
Vertical Zoom Maximum
Vertical Zoom Maximum
Vert Zoom Maximum
Sets or returns the maximum of the range on the vertical axis for the zoomed view. If either Minimum or Maximum is null, the zoom does not happen.
Zooming works only with linear, log, and datetime axes. For dates, use the format "yyyyMMdd".
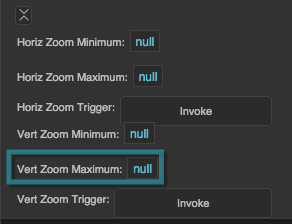
The Vertical Zoom Maximum property
Vertical Zoom Trigger
Vertical Zoom Trigger
Vert Zoom Trigger
Zooms the chart to the range specified by the Vertical Zoom Minimum and Maximum. To return the chart to its pre-zoom view, the user can click on the chart. Zooming works only with linear, log, and datetime axes.
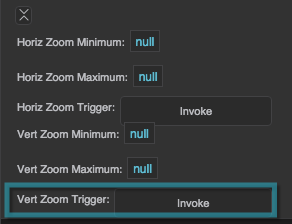
The Vertical Zoom Trigger property