Table of Contents
Axis Properties
These properties affect horizontal and vertical axes for charts.
For a guide to using charts, see Designing Charts.
Axes can also be affected using Effects properties.

Axis properties in the Property Inspector
Video Tutorial: Auto Adjust Property
More video tutorials are here.
Visible
Visible
Visible
Defines whether this element is visible. Regardless of value, the element affects layout and is stored in the user's browser memory. Because the element is stored in memory, performance might be affected.
TRUE
This element is visible.
FALSE
This element is not visible, but it still affects layout and is stored in browser memory.

The Visible property
Display
Display
Display
Defines whether this element is displayed. If it is not displayed, the component does not affect layout. However, regardless of value, the element is stored in the user's browser memory. Performance might be affected as a result.
TRUE
This element is displayed, and it affects layout.
FALSE
This element is not displayed, and it does not affect layout. The element remains stored in browser memory.

The Display property
Title
Title
Title
Defines the title text for this axis. This text appears as an axis title label.

The Title property
Vertical Axis Title Orientation
Vertical Axis Title Orientation
Vertical Axis Title Orientation
Controls axis title orientation for a vertical axis. Orientation can be either Vertical or Flipped Vertical. You might want to select Vertical if the axis is on the left of the chart, and Flipped Vertical if the axis is on the right.
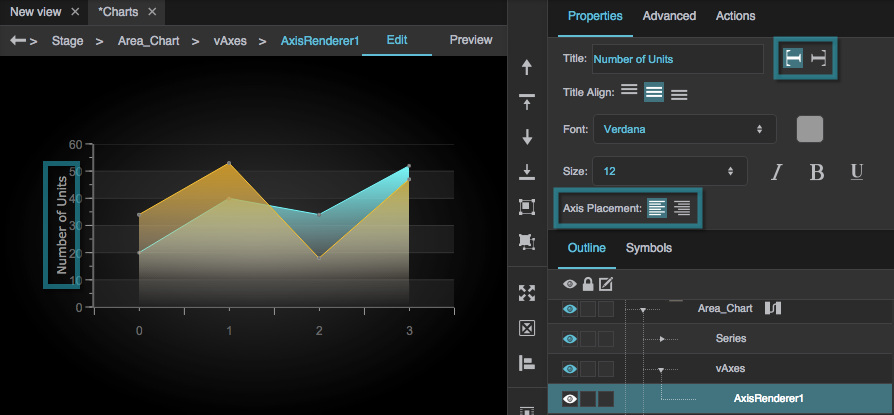
The axis is placed on the left, and the Axis Title Orientation is set to Vertical.
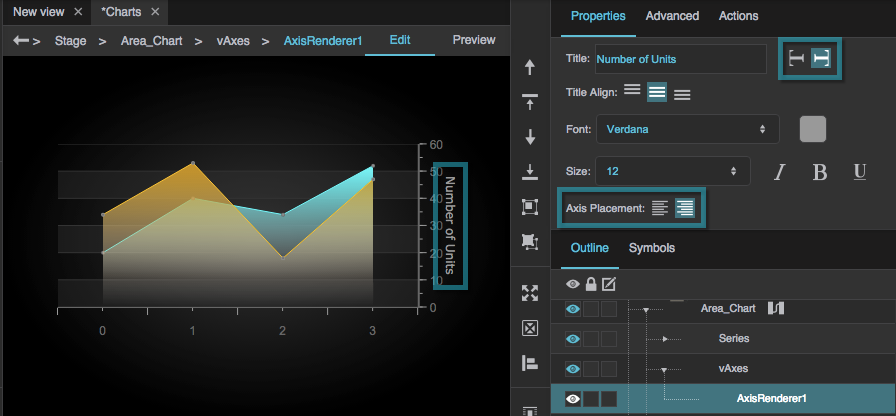
Changing the Axis Placement moves the axis to the right side, and changing the Axis Title Orientation to Flipped Vertical changes the orientation of the text.

The Vertical Axis Title Orientation property
Title Alignment
Title Alignment
Title Alignment
For a vertical axis, specifies whether the axis title is aligned to the top, bottom, or center of the axis. For a horizontal axis, specifies whether the axis title is aligned to the left, right, or center of the axis.

The Title Alignment property
Title Font
Title Font
Font
Defines the font used for the labels along this axis. To add a font to this project and use it for this property, see Text Component Properties.

The Font property
Title Font Color
Title Font Color
Font Color
Defines the font color used for the labels along this axis.

The Font Color property
Title Font Size
Title Font Size
Font Size
Defines the font size used for the labels along this axis.

The Font Size property
Italic
Italic
Italic
Defines whether labels along this axis are italicized.

The Italic property
Bold
Bold
Bold
Defines whether labels along this axis are bold.

The Bold property
Underline
Underline
Underline
Defines whether labels along this axis are underlined.

The Underline property
Axis Placement
Axis Placement
Axis Placement
For a vertical axis, specifies whether the axis is positioned on the left or the right of the chart. For a horizontal axis, specifies whether the axis is positioned on the top or the bottom of the chart.
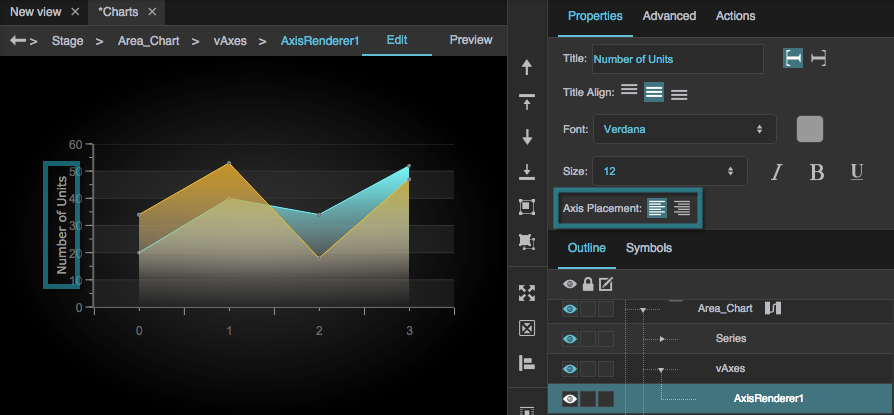
The axis is placed on the left.
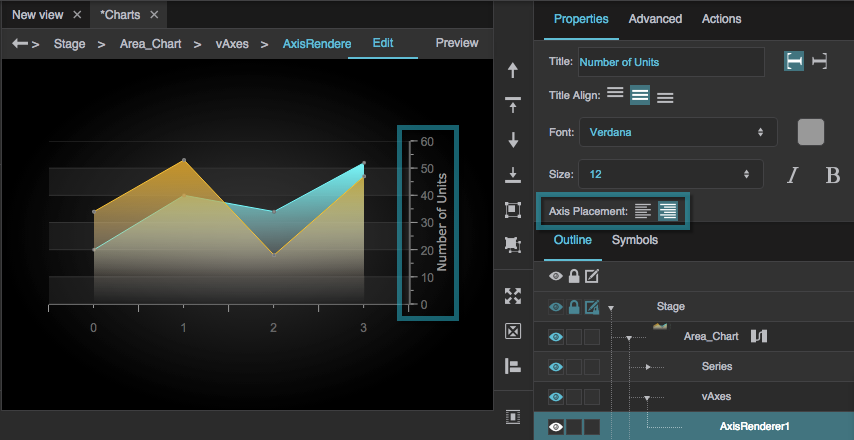
The axis is placed on the right.

The Axis Placement property
Labels
Labels
Labels
Specifies how many labels appear along the axis.
None
No labels appear.
Min Max
Only the minimum and maximum labels appear.
Auto
The number of labels depends on the amount of available space.
Show All
A label appears for every major tick.

The Labels property
Label Vertical/Horizontal Alignment
Label Vertical/Horizontal Alignment
Label Vertical/Horizontal Alignment
For a vertical axis, determines whether the labels are aligned vertically to the top, middle, or bottom of the major ticks. For a horizontal axis, determines whether the labels are aligned to the left, center, or right of the major ticks.

The Label Vertical Alignment property
Label Gap
Label Gap
Label Gap
Defines the distance, in pixels, between the major tick marks and the labels for this axis.

The Label Gap property
Label to Title Gap
Label to Title Gap
Label to Title Gap
Defines the distance, in pixels, between the axis title and the axis labels.

The Label to Title Gap property
Label to Edge Gap
Label to Edge Gap
Label to Edge Gap
Defines the distance, in pixels, between the chart container and the labels for this axis.

The Label to Edge Gap property
Label Rotation
Label Rotation
Label Rotation
Defines the angle of rotation for the labels on this axis. Valid values are between −90 and 90.

The Label Rotation property
Label Symbol
Label Symbol
Label Symbol
Specifies the symbol to use for a custom label renderer.

The Label Symbol property
Use div Labels
Use div Labels
Use div Labels
Specifies whether the labels along an axis are coded as <div> elements, thereby allowing multiline text and HTML tags. By default, labels are rendered as SVG text elements, which are faster but support fewer formatting options.

An example of HTML content used as a div label

The Use div Labels property
Axis Stroke Color
Axis Stroke Color
Axis Stroke Color
Defines the color of the line that represents this axis.

The Axis Stroke Color property
Axis Stroke Style
Axis Stroke Style
Axis Stroke Style
Defines the stroke style of the line that represents this axis.

The Axis Stroke Style property
Axis Stroke Weight
Axis Stroke Weight
Axis Stroke Weight
Defines the stroke weight of the line that represents this axis.

The Axis Stroke Weight property
Axis Type
Axis Type
Axis Type
Defines the scale type of an axis.
Linear Axis
The axis represents linearly increasing values.
Log Axis
The axis represents logarithmically increasing values. You might want a logarithmic axis if your data has a large range.
Datetime Axis
The axis represents linearly progressing date and time.
Category axis
The axis uses categories instead of a scale. Use a category axis when the data's linear progression doesn't matter, or when there is no way to interpret the data as a number or a date.

The Axis Type property
Inverted
Inverted
Inverted
Controls whether this axis is inverted.
TRUE
The smaller values appear at the top if this axis is vertical, or the right if it is horizontal. For a category axis, the top values in the table appear at the top or right of the axis.
FALSE
The smaller values appear at the bottom or left of the axis. For a category axis, the top values in the table appear at the bottom or left of the axis.

The Inverted property
Format String
Format String
Format String
Defines the format used for the axis labels. For example, a Datetime axis might use the string "MM/dd/yyyy", and a number axis might use the string ",##0.00". See here for a complete list of formats.

The Format String property
Auto Adjust
Auto Adjust
Auto Adjust
Specifies whether the axis range and ticks intervals are determined automatically based on the data feeding the chart.

The Auto Adjust property
Base At Zero
Base At Zero
Base At Zero
Allows you to change the axis range minimum to decrease unused space on the chart.
TRUE
The axis minimum is zero, unless there are negative data values on this axis. In that case, the axis minimum is equal to, or slightly below, the lowest data value.
FALSE
The axis minimum is equal to, or slightly below, the lowest data value.

The Base At Zero property
Axis Minimum
Axis Minimum
Axis Minimum
Defines the minimum of the axis range.

The Axis Minimum property
Axis Maximum
Axis Maximum
Axis Maximum
Defines the maximum of the axis range.

The Axis Maximum property
Major Interval
Major Interval
Major Interval
Defines the interval between each consecutive pair of major ticks, in the units of the axis.

The Major Interval property
Major Tick Placement
Major Tick Placement
Major Tick Placement
Specifies whether the major ticks appear on the inside, outside, or center of the line that represents this axis.

The Major Tick Placement property
Major Tick Stroke Color
Major Tick Stroke Color
Major Tick Stroke Color
Defines the stroke color of the major ticks.

The Major Tick Stroke Color property
Major Tick Stroke Weight
Major Tick Stroke Weight
Major Tick Stroke Weight
Defines the stroke weight of each major tick.

The Major Tick Stroke Weight property
Major Tick Length
Major Tick Length
Major Tick Length
Defines the length of each major tick.

The Major Tick Length property
Minor Tick Interval
Minor Tick Interval
Minor Tick Interval
Defines the interval between each consecutive pair of minor ticks, in the units of the axis.

The Minor Tick Interval property
Minor Tick Placement
Minor Tick Placement
Minor Tick Placement
Specifies whether the minor ticks appear on the inside, outside, or center of the line that represents an axis.

The Minor Tick Placement property
Minor Tick Stroke Color
Minor Tick Stroke Color
Minor Tick Stroke Color
Defines the stroke color of the minor ticks.

The Minor Tick Color property
Minor Tick Stroke Weight
Minor Tick Stroke Weight
Minor Tick Stroke Weight
Defines the stroke weight of each minor tick.

The Minor Tick Stroke Weight property
Minor Tick Stroke Length
Minor Tick Stroke Length
Minor Tick Stroke Length
Defines the length of each minor tick.

The Minor Tick Length property
Compare Mode
Compare Mode
Compare Mode
Defines the Compare Mode of this axis. Use a Compare Mode when you want to overlay data for different dates and times. See Designing Charts.
None
Series with different dates and times are not aligned.
Hour
Times of day are aligned, so you can compare midnight with midnight.
Day
Date ranges are aligned, so you can compare "day one" from different ranges.
Week
Days of the week are aligned, so you can compare Mondays with Mondays.
Month
Days of the month are aligned, so you can compare firsts of the month.
Year
Days of the year are aligned, so you can compare January first with January first.

The Compare Mode property
Data Units
Data Units
Data Units
Defines the units for this Datetime axis.
A value of Auto means that units are determined automatically based on the data feeding the chart.

The Data Units property
Data Interval
Data Interval
Data Interval
Defines the interval between each consecutive pair of major ticks, in the units of the axis. This property is ignored if the Data Units property is set to Auto.

The Data Interval property
Data Provider
Data Provider
Data Provider
Defines the table that feeds data to this category axis.

The Data Provider property
Category Field
Category Field
Category Field
Defines the table column that contains category names.

The Category Field property
Category Order
Category Order
Category Order
Defines the order of the categories on this axis, as a list of comma-separated values.

The Category Order property
Computed Minimum
Computed Minimum
Computed Minimum
Returns the minimum of the axis range, which is defined either automatically or by the Axis Minimum or Data Interval property. This is a read-only property, so changing it does nothing.

The Computed Minimum property
Computed Maximum
Computed Maximum
Computed Maximum
Returns the maximum of the axis range, which is defined either automatically or by the Axis Maximum property. This is a read-only property, so changing it does nothing.

The Computed Maximum property
Computed Interval
Computed Interval
Computed Interval
Returns the interval between major ticks, which is defined either automatically or by the Major Interval property. This is a read-only property, so changing it does nothing.

The Computed Interval property