Pie Chart Properties
These properties affect pie charts. For pie charts, you can customize properties for the chart, series, wedge fills, and labels.
For a guide to using pie charts, see Pie Chart.
Pie charts are also affected by Common Properties and Datatips Properties.
General Pie Chart Properties
These properties affect the entire pie chart.
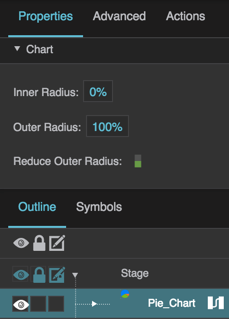
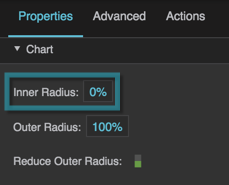
Inner Radius
Inner Radius
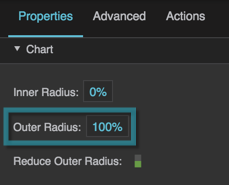
Outer Radius
Outer Radius
Outer Radius
Defines the radius of this pie chart, as a percentage of the radius of the largest pie chart that would fit. This depends on container size.
If the Reduce Outer Radius property is TRUE, then the radius size might be automatically reduced in order to fit labels or other elements.
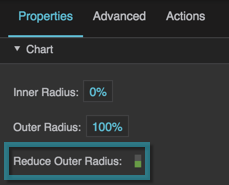
Reduce Outer Radius
Reduce Outer Radius
Reduce Outer Radius
Defines whether the pie chart radius shrinks automatically in order to fit labels or other elements.
TRUE
The pie chart radius might be smaller than that determined by the Outer Radius property, in order to fit labels or other elements.
FALSE
The pie chart size is determined by the Outer Radius property only.
Pie Chart Series Properties
These properties affect a pie chart series.
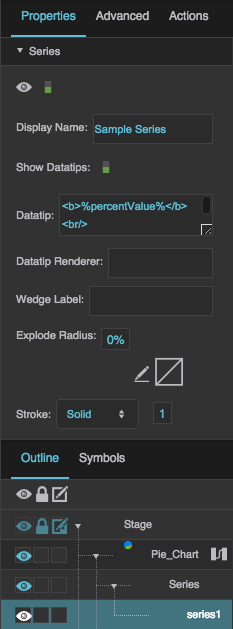
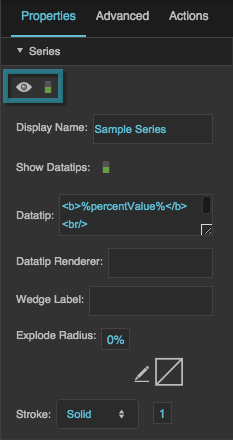
Visible
Visible
Visible
Defines whether this series is visible. Regardless of value, the series affects layout and is stored in the user's browser memory. Because the series is stored in memory, performance might be affected.
TRUE
The series is visible.
FALSE
The series is not visible, but still affects layout and is stored in browser memory.
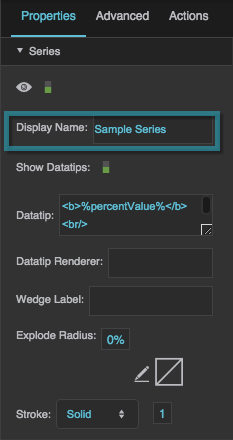
Display Name
Display Name
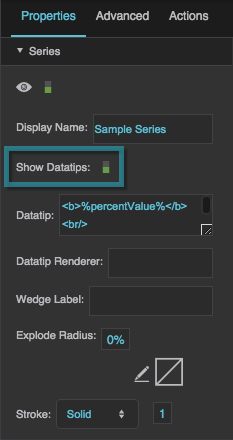
Show Datatips
Show Datatips
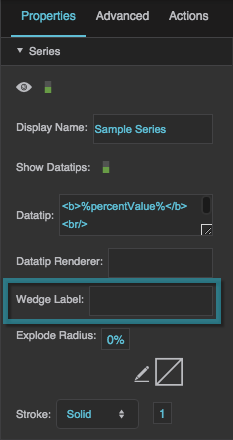
Wedge Label
Wedge Label
Wedge Label
Configures the text displayed in wedge labels for this series. Use the same tags you would use for a datatip.
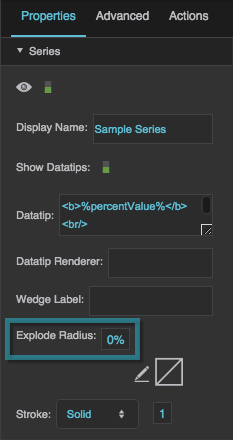
Explode Radius
Explode Radius
Radial Stroke Color
Radial Stroke Color
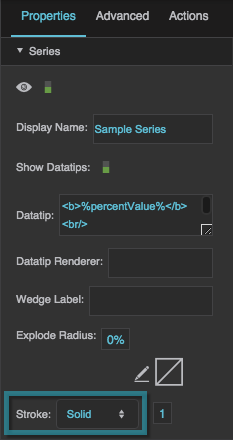
Radial Stroke Style
Radial Stroke Style
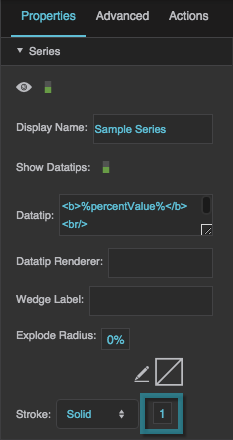
Radial Stroke Weight
Radial Stroke Weight
Pie Chart Wedge Fill Properties
These properties affect the pie chart colors.
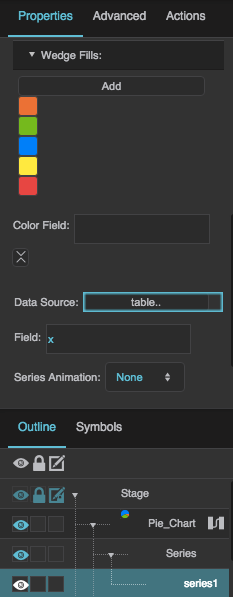
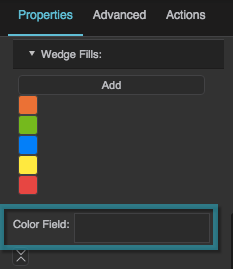
Color Field
Color Field
Color Field
Specifies the table column that contains data from which to determine wedge colors. The following formats are supported:
- #EEE: Any shortened, three-digit hexadecimal color string, including the # symbol.
- #FF00FF: Any hexadecimal color string, including the # symbol.
- rgba(255, 0, 0, 0.5): Any RGBA color string, including "rgba" and the parentheses.
You can also specify colors in the Property Inspector by expanding Wedge Fills.
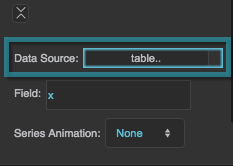
Data Source
Data Source
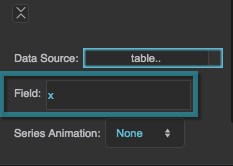
Field
Field
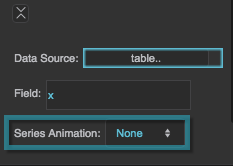
Series Animation
Series Animation
Series Animation
See General Series Properties.
Pie Chart Labels Properties
These properties affect the placement and appearance of pie chart labels.
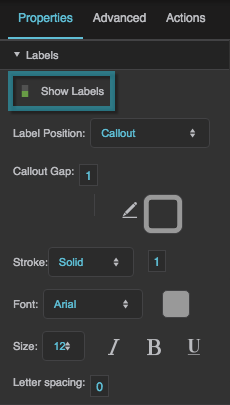
Show Labels
Show Labels
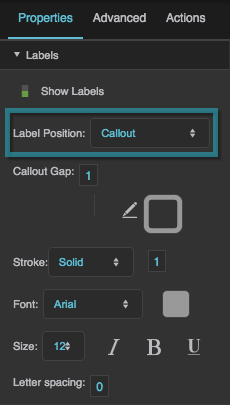
Label Position
Label Position
Label Position
Defines the position of the labels.
None
There are no labels.
Outside
Labels are positioned for each pie wedge, near the outer edge of the pie series. Labels might be inside or outside the wedges, depending on the outer radius of the series.
Callout
Labels are positioned outside of the chart, with callout lines.
Inside
Labels are positioned inside each pie wedge.
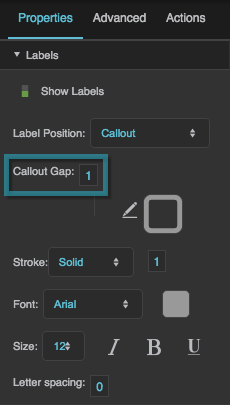
Callout Gap
Callout Gap
Callout Gap
Defines the amount of empty space, in pixels, that is added to the gap between the edge of the pie and the edge of the labels. Does not define the entire gap, but rather the amount that is added to the default gap. A negative value makes the gap smaller than the default.
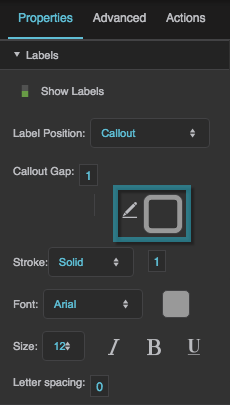
Callout Stroke Color
Callout Stroke Color
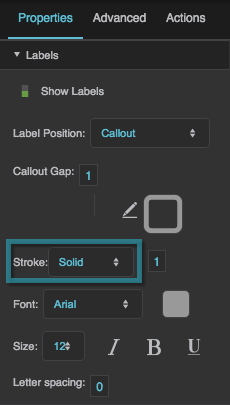
Callout Stroke Style
Callout Stroke Style
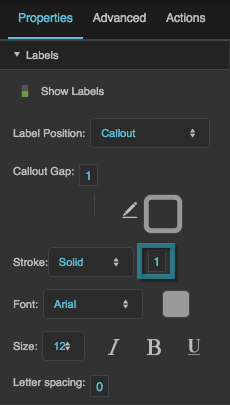
Callout Stroke Weight
Callout Stroke Weight
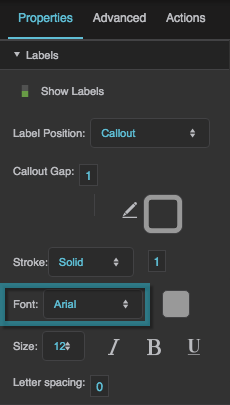
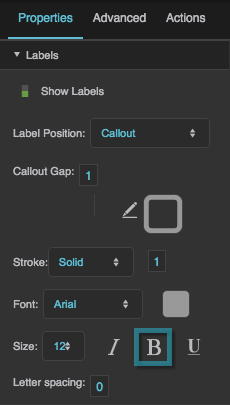
Font
Font
Font
Defines the font for the wedge callout labels. To add a font to this project and use it for this property, see Text Component Properties.
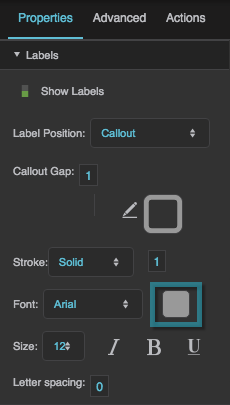
Font Color
Font Color
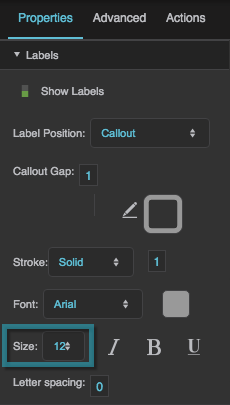
Font Size
Font Size
