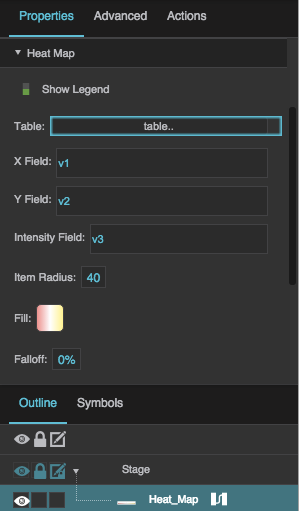
Heat Map Properties
These properties affect the heat map component.
For a guide to using the heat map component, see Heat Map.
Heat maps are also affected by Common Properties.
dglux5_wiki:widgets_and_property_inspector:property_inspector:heatmap:home
These properties affect the heat map component.
For a guide to using the heat map component, see Heat Map.
Heat maps are also affected by Common Properties.

The Heat Map properties in the Property Inspector
Show Legend
Show Legend
X Field
X Field
Y Field
Y Field
Intensity Field
Intensity Field
Intensity Field
Defines the table column from which the intensity values are determined.
"Intensity" refers to whatever units the heat map is measuring, for example temperature or air flow. Each data point on the heat map has an intensity value that determines its color.
Intensity values range from 0 to the highest data value. An intensity of 0 corresponds to the left end of this heat map's gradient, and the highest intensity value corresponds to the right end of this heat map's gradient.
Item Radius
Item Radius
Fill
Fill
Fill
Defines the colors for the heat map gradient. The left color indicates the lowest intensity, middle colors indicate medium intensity, and the right color indicates the highest intensity.
Falloff
Falloff
Falloff
Defines the percentage of each heat map item that is covered by the highest intensity color for that shape. The specified inner portion of the shape is covered by the color representing the intensity of the data point. The remaining outer portion of the shape blends from the color of this intensity value to the color of an intensity value of zero.