Table of Contents
Heat Map
This page includes steps for creating a heat map layer on an image.
Typically, a heat map positions color-coded circular elements at specified locations on an image, for the purpose of visualizing some data that you want to associate with the image. For example, to visualize temperature by room, you could position a circular element on each room in a floor plan, and you could color code these markers according to temperature. To create a heat map layer on an image, first you group an image component and a heat map component, and then you load tables that describe the marker locations and the temperature data.
In a heat map, the data value used for color coding is called the "intensity" value.
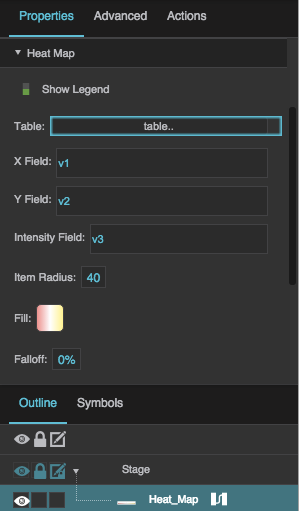
For a detailed reference of properties that affect heat map components, see Common Properties and Heat Map Properties.
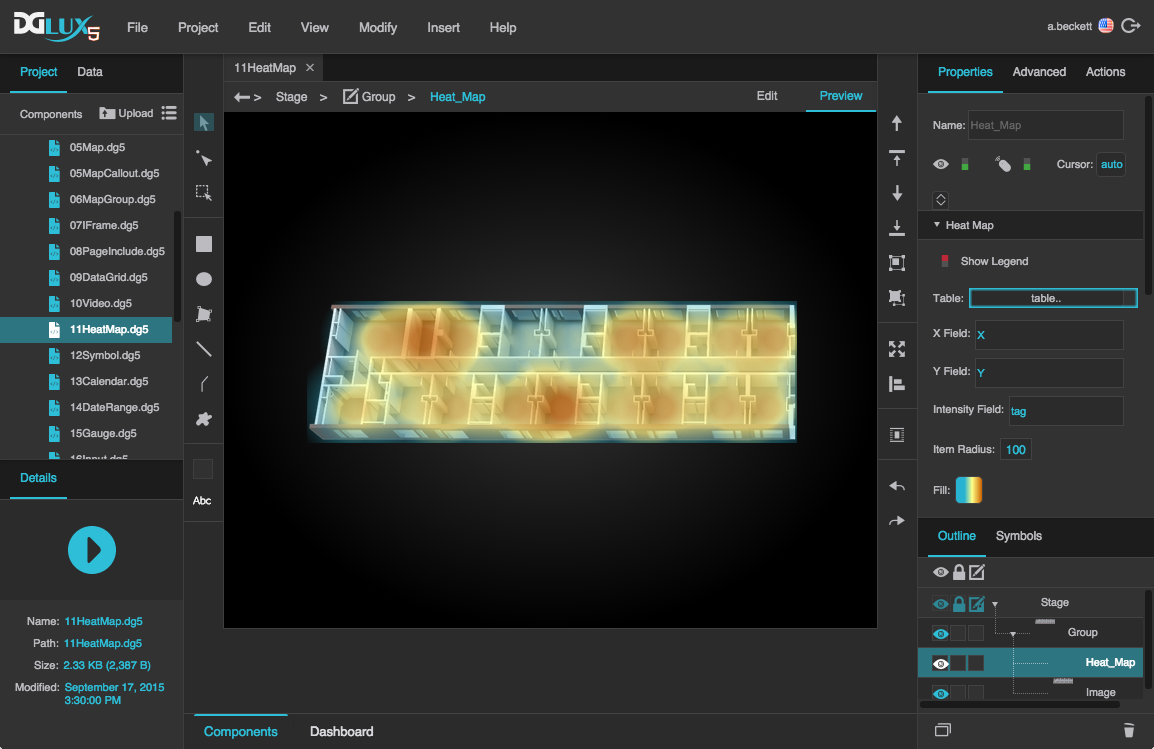
A heat map component in DGLux5
Create a Heat Map Layer on an Image
These steps show one way to create a heat map overlay for an image.
Note
In some cases, you might be able to combine steps 2 to 4 by writing a single query that includes X, Y, and intensity values.
- Set up the group:
- In the Outline, right-click the Stage and select Insert > Component > Group.
- Right-click the group and select Insert > Component > Image.
- In the Property Inspector, specify the URL of the image asset.
- With the image selected, just above the Position and Size properties, click the
 Auto Size button.
 - With the group selected, in the Scaling properties, select Fit Ratio and set Autosize Content to TRUE.
- In the Outline, right-click the group and select Insert > Component > Heat Map.
With the heat map selected, hover over the
 Width property until a blue dot appears, and double-click the blue dot. Do the same for the
  Height property.
This creates a small binding pop-up dialog that includes the two properties.
- With the image selected, in the Property Inspector, click the blue dot next to the image's Width and drag it to the heat map's Width in the small pop-up dialog.
- Repeat step 1h for Height.
- Use a table to define locations on the image. To add this table manually:
- Open the dataflow for the heat map.
- Delete the Table block in the dataflow.
- Add a new Table block, and name it locations.
- Open locations, and rename the three columns X, Y, and tag.
- In this table, enter data describing where your circular elements should appear at the full pixel size of the image.
- X is the distance in pixels from the left edge of the component.
- Y is the distance in pixels from the top edge of the component.
- tag is some string that identifies the point, such as a device ID or room number. These values should match strings in the next table.
Load a second table that includes your "intensity" data.
This table can be loaded using a query, a CSV or JSON file, or some other means. It must include a column of data to be used for intensity values and a column of identifying strings matching the tag values in the previous table.
- Join the two tables:
- Add a Join block to the dataflow.
- In the dataflow, link the locations table to input1 and the intensity table to input2.
- For column1, type tag.
- For column2, type the name of the column containing the identifying strings that match the tag strings.
- For join, select Left.
- Link the joined table to your heat map:
- In the Outline, select the heat map.
- In the Property Inspector, expand the Heat Map properties.
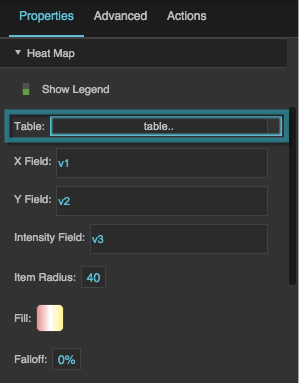
- In the dataflow, click the blue dot next to the output table of the Join block, and drag it to the Table property in the Property Inspector.
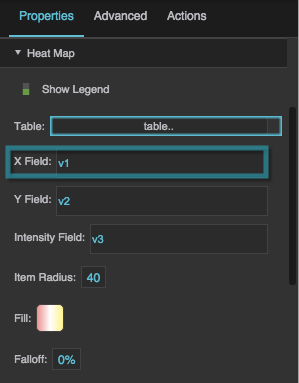
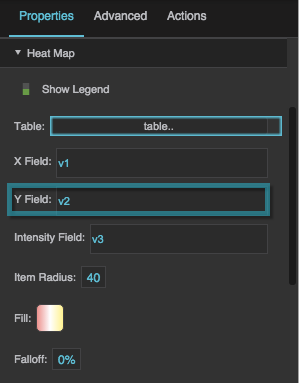
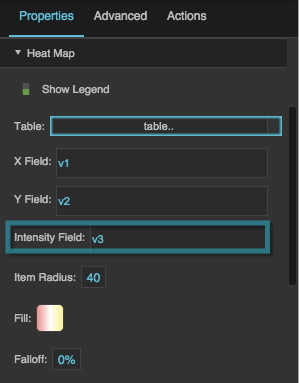
In the Property Inspector, for X Field, Y Field, and Intensity Field, type the names of the relevant columns in the joined table.
Circular elements now appear on your heat map.
- Style the gradient:
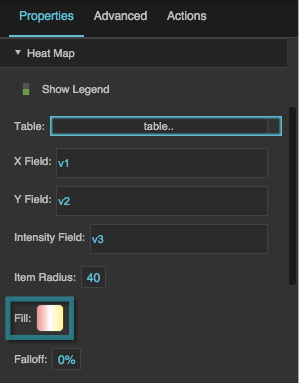
- To open the gradient dialog, click the
 swatch in the Property Inspector.
 - To change a color value, click the small square below the track and then use the color picker.
- To add a color, click below the track.
- To delete a color, right-click the small square below the track.
- Drag colors to move them. To start the gradient at a value larger than 0, drag the leftmost square to the right.
- Style the circular elements:
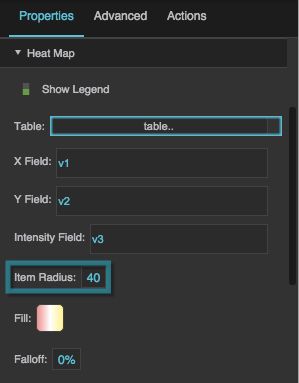
- To make the circular elements larger or smaller, change the Item Radius property.
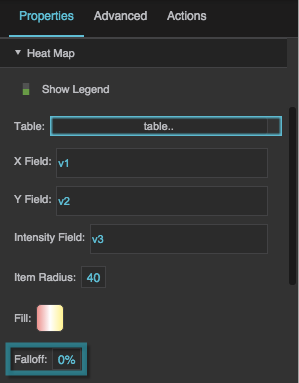
- Experiment with changing the Falloff value. This value affects the radius percentage that is covered by the central color of the element.
- Style the legend:
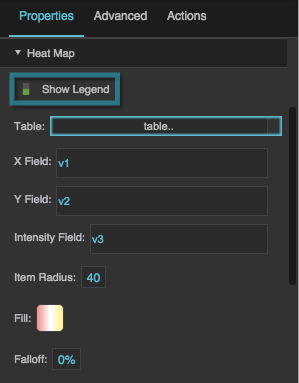
- If you do not want to show the default legend, set the Show Legend property to FALSE.
- To change the starting and ending numbers of the legend, click the
 swatch and drag the rightmost and leftmost gradient colors toward the center of the track.
Notes
- The gradient and legend cannot display values lower than 0. Values below 0 are represented as 0.
- The gradient and legend cannot display a value higher than the highest intensity data value in the table.
