Mapbox GL Map
The GL Map, from Mapbox, is a high-performance alternative to the Google Map component. GL Maps provide some features that Google Maps do not offer, most notably layers.
A Mapbox access key is required to use this component. To obtain a Mapbox access key, go to www.mapbox.com and create an account. You can then view your key at https://www.mapbox.com/studio/account/tokens/
To add a GLMap, select the stage or group where you want the map to reside and choose Insert > Components > Mapbox GL Map.
The current extent of the map is reflected in its boundsNorth, boundSouth, boundsEast and boundsWest properties. To change the extent of the map, set these properties.
Styling a GM Map
To control the overall appearance of a GL Map component, you can apply styles. To apply a style to a GL Map component, you specify the location of the style in the GL Map's Map Style property using a URL of the form:
mapbox://styles/:owner/:style
Where owner is your Mapbox account name and style is the style ID. For available styles, see https://www.mapbox.com/studio/styles/.
Map Layers
To add layers to a GL Map, selected the map and choose Insert > Components. The following types of layers can be added:
- Heatmap: Uses color coding to highlight how heavily location points are clustered.
- Marker: Displays circle markers for a set of coordinates. Optionally clusters marker when the map is zoomed out beyond the distance at which the markers can be individually resolved.
- GeoJSON: Enables you to populate and style the layer using GeoJSON.
- Tile: Enables you to overlay vector tiles on the map.
Animating Markers on a Map
To mark locations on a GL Map marker layer using coordinate data:
- Bind the map's Data property to a table containing the coordinates that you want to map. The table can be populated using data flow logic. For example, you can use a CSV file containing location data as input for a String Loader block and feed the resulting output to a CSV Parser, which outputs a table that can be bound to the maps Data property.
- To specify the symbol to be displayed at the coordinates, set the map's Symbol field to the DGLux5 symbol to be used.
- Set the Latitude Field and Longitude Field properties to the names of the table columns containing the corresponding data.
Marker layers provide an animation feature that enables you to display location changes over time for specific points. To enable animation, set the layer's animatedIdValues property to true. To provide the data required to animate points, you need a table that contains, at a minimum, the latitude and longitude and a unique identifier for the point. The primary properties of interest for animating a marker layer are as follows:
- idField: Unique ID for the animated points, for example, a flight number.
- idValueAnimationDuration: How long, in milliseconds, the point takes to move from the old location to the new location.
- Lat Field: The table column containing latitude.
- Long Field: The table column containing longitude.
- filter: The table column and value that determine what points to display, if you need a simple way to reduce the data displayed on the layer.
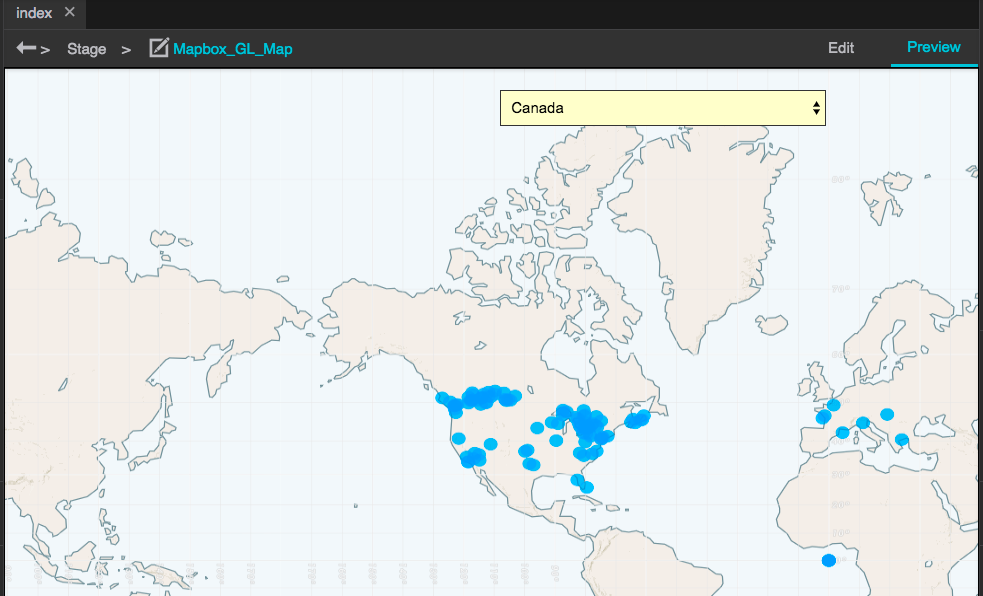
The following example uses a flight location feed to populated an animated marker layer, filtering flights by country of origin as specified by the user in the text field at top left. The following figure shows the resulting map. (To see the details, download this example as a zip file, then import the project into DGLux5.})
The data used to plot this map comes from this table:
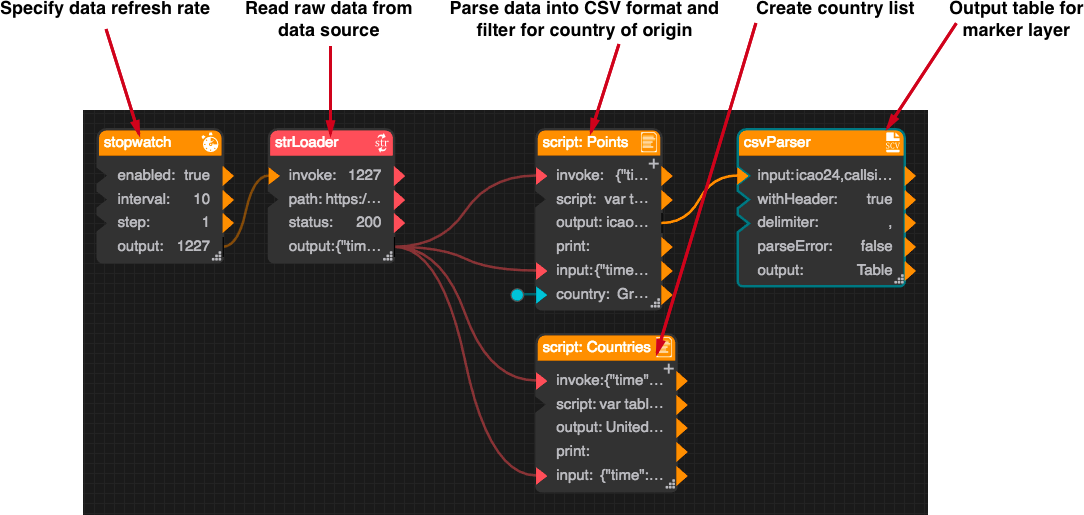
The dataflow that generates the preceding table is composed as follows:
The string loader block loads data from opensky-network.org. The script block uses the following code to parse the raw data into CSV format for the CSV parser block:
  var table = JSON.parse(@.input);
  var rows = [];
  table.states.forEach(function(state) {
  // lat/lng is not provided for planes that are on the ground
 if (state[8] == true) {
  return;
  }
  var row = state.join(',').split('null').join('').split(' ').join('').trim();
  if (row.indexOf(@.country) != -1) {
   rows.push(row);
   }
  });
  return "icao24,callsign,origin_country,time_position,time_velocity,longitude,latitude,altitude,on_ground,velocity,heading,vertical_rate,sensors\n" + rows.join('\n');
To implement this example:
- Add a GL Map component and a dropdown list to the stage or a group.
- Select the GL Map and add a marker layer to it.
- Edit the dataflow of the GL Map and create the dataflow shown in the figure above. Paste the code from above into the Points and Countries script blocks.
- Bind the output of the Countries script block to the Options property of the dropdown list.
- Bind the Value property of the dropdown list to the Country input of the Points script block.
Styling Areas on a GeoJSON Layer
To style areas in a Map GL map, you can populate a geoJSON layer with a set of geoJSON polygons and specify styles to be applied to specific areas using the identifier for the area. A simple example is color-coding a map of states, but you can apply styling to any map style parameter. For a list of map style parameters, see https://www.mapbox.com/mapbox-gl-js/style-spec. The example below is based on GeoJSON data that describes US state borders. (View sample data)
To style areas on a Map GL map, add a GeoJSON layer and perform the following steps:
- Populate the GeoJSON Data property with the code that defines the polygons that you want to style.
- Set the Layer type property to Fill.
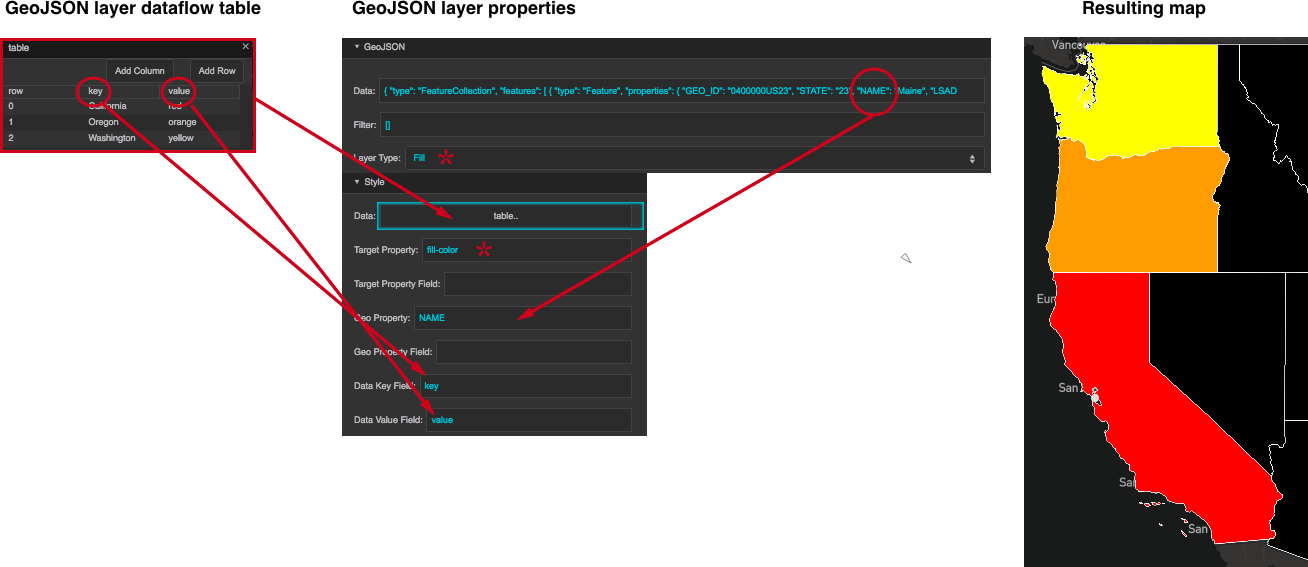
- Open the layer's dataflow and add a Table block. Edit the table so that it is composed of two columns: a key column and a value column. In the key column, enter the identifier of the area or feature to be styled (for example, the value specified for the "NAME" field in the geoJSON data.) In the value column, specify the style setting to be applied to that feature.
- Bind the dataflow table to the Data property in the layer's Style section.
- Set the layer's properties as follows:
- geo Property: The name of the geoJSON field containing the values that will drive the styling (for example, the "NAME" field in the GeoJSON file contains the name of the state described by the polygon)
- Target Property: The map style property that you want to set. Example: fill-color.
- Data Key Field: The name of the dataflow table column that contains the values corresponding to those in the geo Property field (for example, state names).
- Data Value Field: The name of the dataflow table column that contains the value to be assigned to the style setting.
- styleType: Set to Categorical.
The following figure shows the relationships among the settings required to style individual features in a GeoJSON layer.
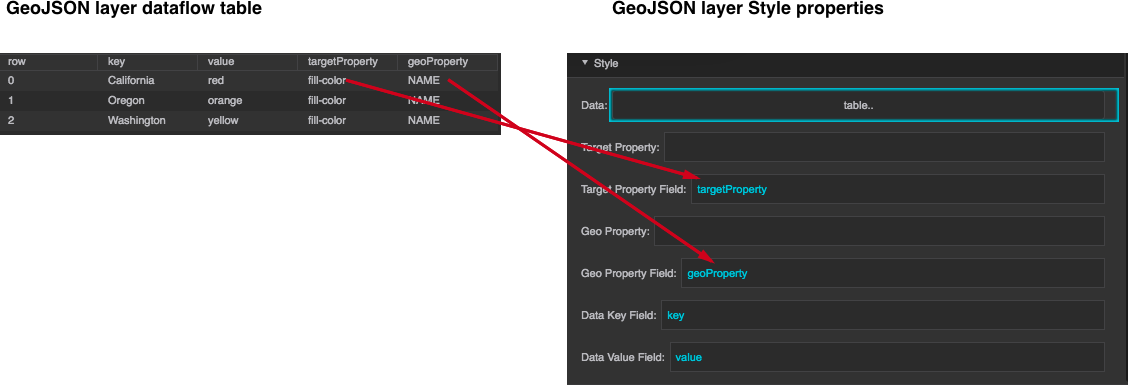
If you require more flexibility in styling, for example, to set multiple style settings for the same geographic feature, you can use the dataflow table to specify the style setting you want to affect and the field in the GeoJSON source that affects it. The following figure illustrates the required table columns and their relationship to the map's Style property settings.
Populating a Tile Layer
To display tile data in a GL Map, add a tile layer to the map and set its URL property to the location of the tile data, for example:
http://server.arcgisonline.com/ArcGIS/rest/services/World_Imagery/MapServer/tile/{z}/{y}/{x}
The tile layer's Tile Size property specifies tile size in pixels. For best results, specify multiples of 8. Note that smaller tiles provide better resolution at the expense of rendering speed. Maximum tile size is 512.
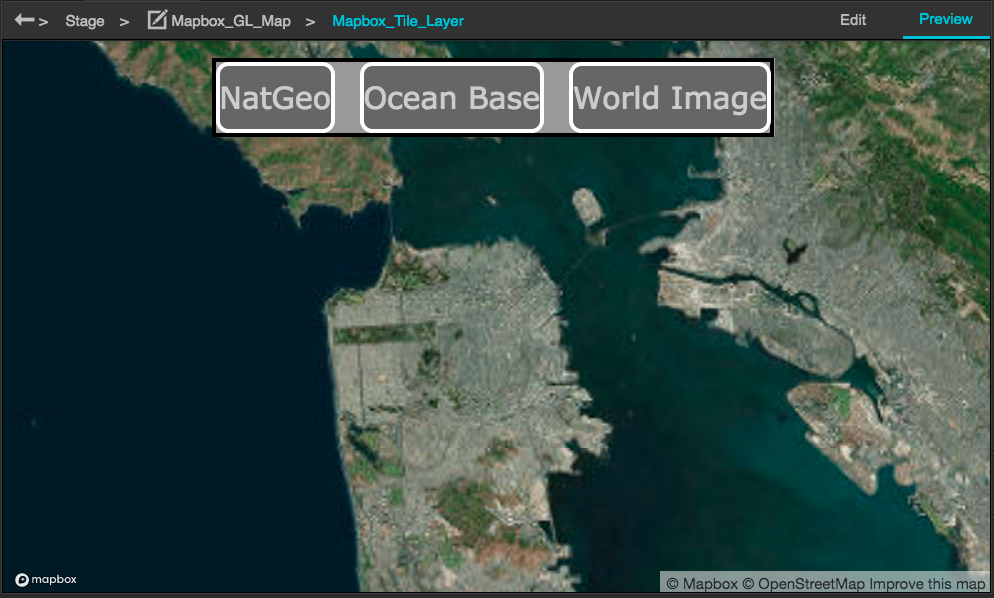
The following example enables the user to choose the tile set that is displayed in the tile layer by clicking a button, as shown in the following figure.
To implement the example, perform the following steps:
- Create the buttons: Add a group to the stage and populate the group with text components, styled as you wish. Set the text of each text component to describe the corresponding tileset.
- Edit the dataflow of the GL map as follows: Add a Table block and edit it so that it contains a single column named "URL," which contains the URLs of the tile sets that you want to display in the layer. Ensure that the order of the URLs corresponds to the order of the buttons in the button group.
- Set the URL field property of the tile layer to "URL," which is the name of the table column where the URLs reside.
- Add a tableSelect block to the dataflow and create the following bindings for it:
- input: Bind from the table you created in the preceding step
- indexes: Bind from the Selected Index property of the button group
- output: Bind to the Data property of the tile layer
The following figure shows the table containing the URLs for tile layers.

To verify that you have implemented the example correctly, click Preview. When you click a button in the button group, the Selected Index of the property group changes, and the value of that property correspond to the table row that is used to populate the URL property of the tile layer, changing the display.
