Google Map

The Google Map component is a customizable, interactive Google Map. It includes a repeater that can render a given symbol once for each row of data in a table. Each instance of the symbol appears at the latitude and longitude specified in the table and can have other dynamic properties.

For a detailed reference of properties that affect Google Maps components, see Common Properties and Google Map Properties.

Important

To use the Google Maps API, include a JavaScript dataflow block in the dataflow for the map component.


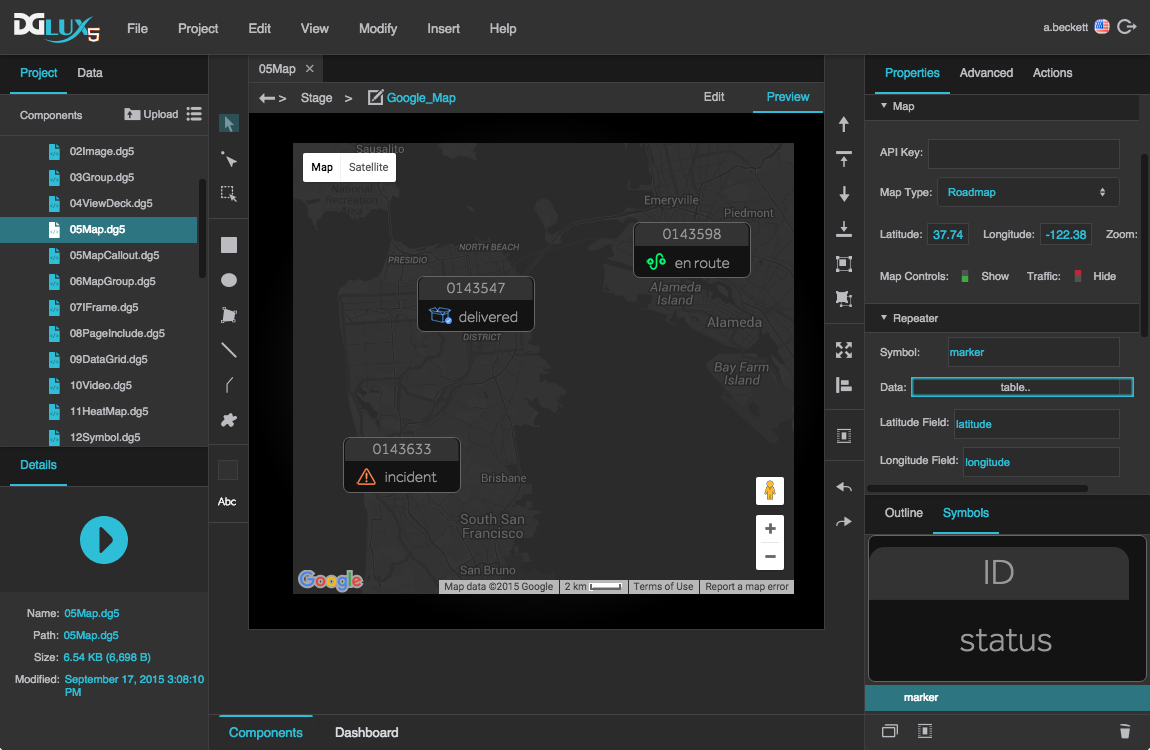
A Google Map component in DGLux5. This map uses a repeater and custom styling.


Video Tutorial: Custom Google Maps Dashboards

More video tutorials are here.


Create a Google Map Component in DGLux5

To create a Google Map component with a repeater:

  1. Right-click in the Outline or the Document window, and select Insert > Components > Google Map.
  2. Create a symbol to act as your map marker.

    If you want instances of the symbol to have dynamic properties other than latitude and longitude, create parameters for the symbol. Bind the parameters to the relevant properties. See Symbol.

  3. Open the dataflow for the Google Map component.

    The dataflow contains a table.

  4. Load the latitude and longitude data that you want to use.

    You can do this by deleting the existing table and loading a new one as discussed in Working with Tables. Or, you can open the existing table and edit it manually.

    If you are using a symbol with parameters, your table must include columns for the parameter values.

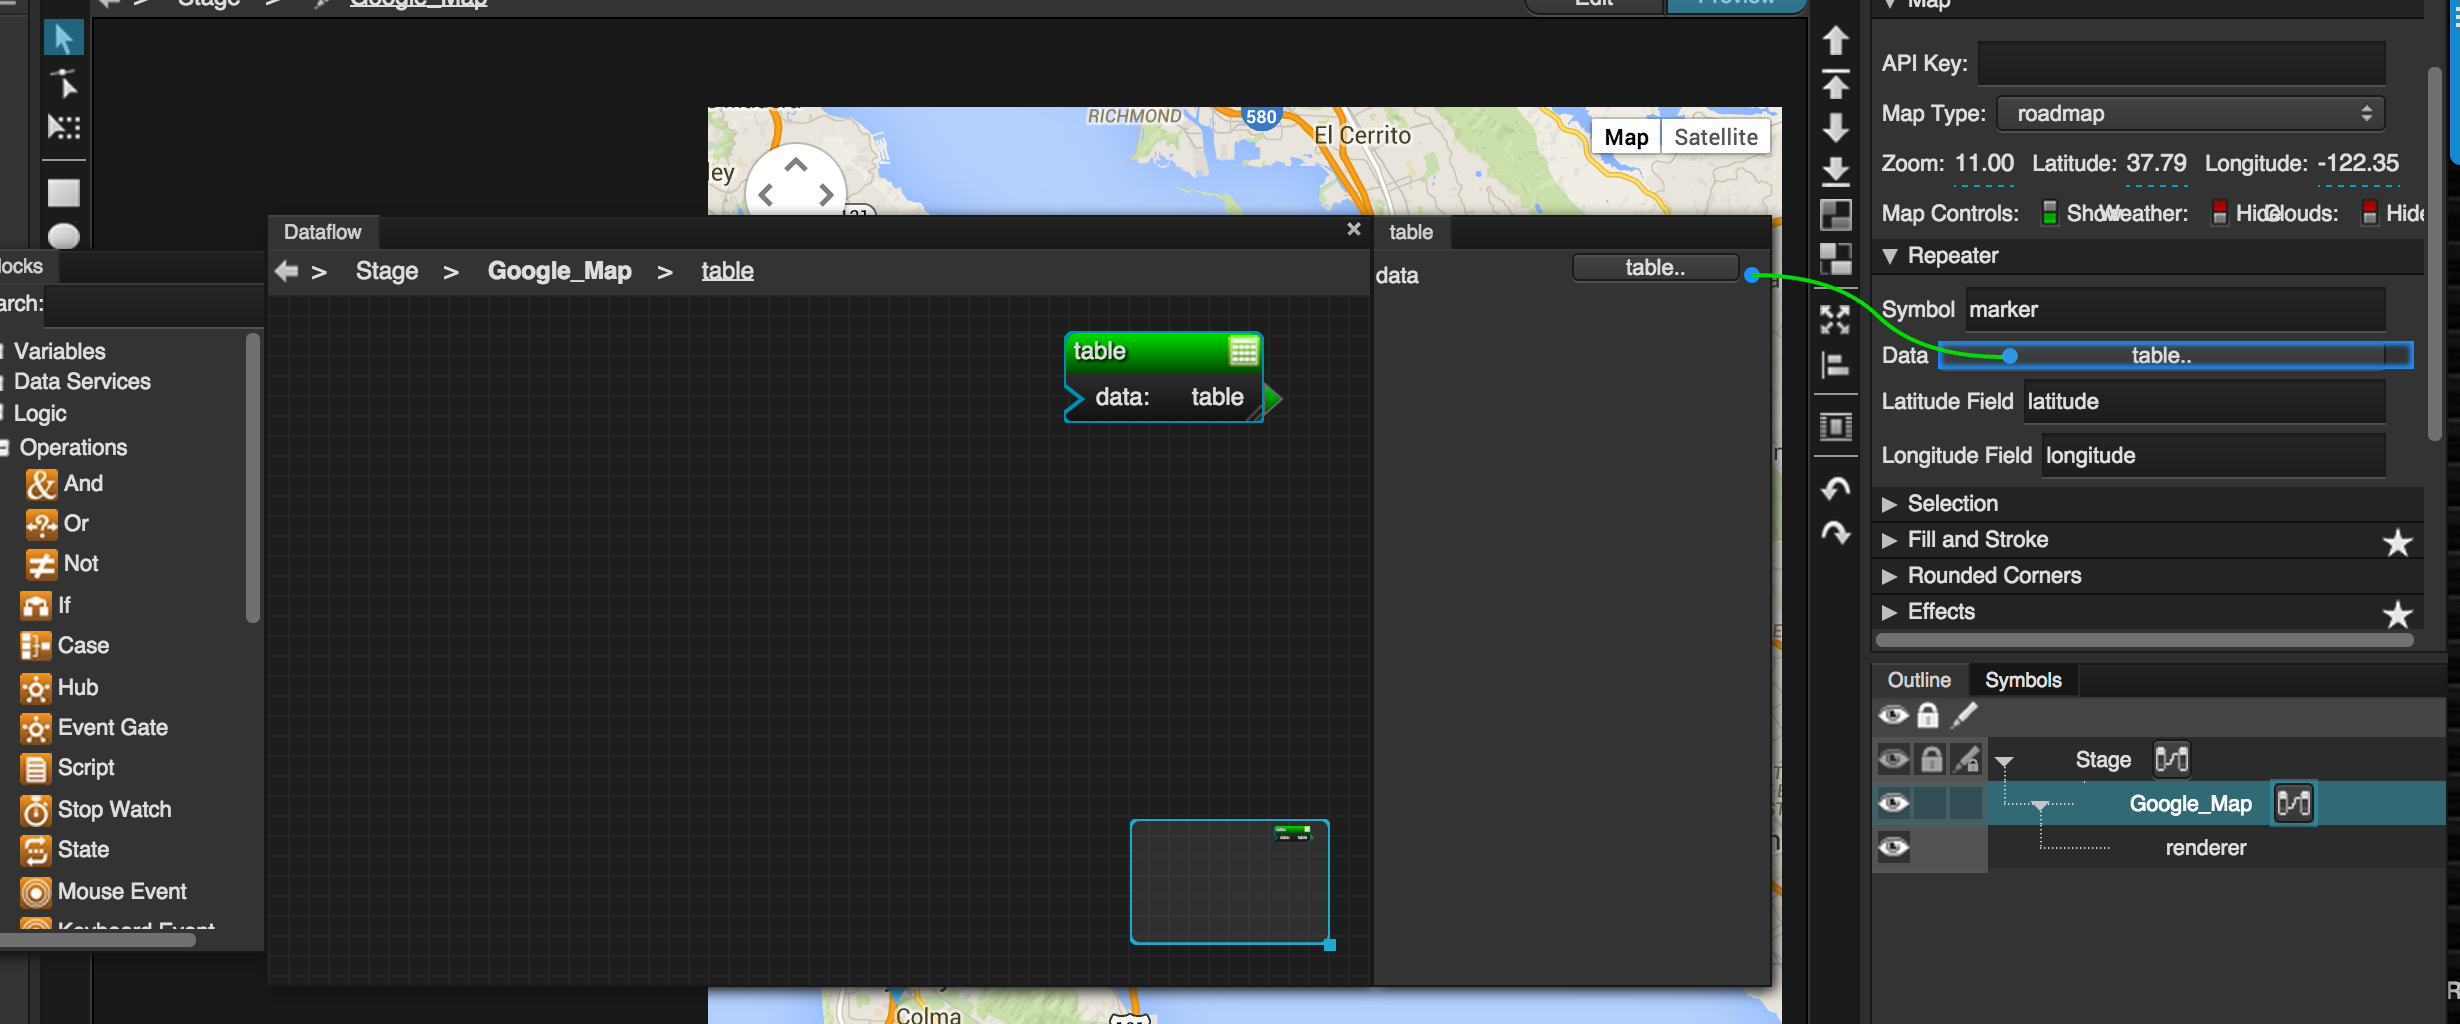
  5. In the Outline, select the map.
  6. In the Property Inspector, under Repeater:
    1. For Symbol, type the name of the symbol.
    2. Bind the table containing your latitude and longitude data to the Data property.
    3. For Latitude Field and Longitude Field, type the names of the table columns that contain this data.
  7. In the Outline, select the "renderer" node that is a child of the map.
  8. In the Property Inspector, for each symbol parameter, either enter a value or bind a table column.

    To bind a table column, open the table in dataflow and drag the column header to this field.


Use JSON Styles

You can find JSON for a selection of pre-made map styles here.

You can also create JSON for a custom style using this wizard.

To pass a JSON object for map style to DGLux5:

  1. Copy the JSON code.
  2. In the Outline or Document window, select the Google Map component.
  3. In the Advanced properties, for the mapStyles property, click Edit in Window.
  4. Paste the JSON in the pop-up, and click OK.

Google Maps FAQ

This section provides answers to some common questions about creating Google Map components in DGLux5.

For frequently asked questions about manipulating the tables that determine the placement of markers by a map repeater, see Working with Tables.
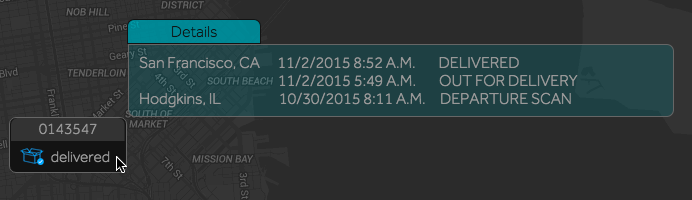
How do I show or hide satellite, road map, terrain, or traffic information?

How do I show or hide satellite, road map, terrain, or traffic information?

How do I show or hide satellite, road map, terrain, or traffic information?
To show or hide satellite, road map, or terrain data:

  1. In the Outline or Document window, select the Google Map component.
  2. In the Property Inspector, under Map, edit the Map Type property.
    • Roadmap shows the default, road map view.
    • Satellite shows Google Earth satellite images.
    • Hybrid shows a mixture of road map and satellite images.
    • Terrain shows a physical map based on terrain data.

To show or hide the Google Maps traffic layer:

  1. In the Outline or Document window, select the map.
  2. In the Property Inspector, under Map, edit the Traffic property.

How do I change the location and zoom level at which the map opens?

How do I change the location and zoom level at which the map opens?

How do I change the location and zoom level at which the map opens?
By default, the map opens on San Francisco, CA, with a zoom level of 10.

To manually change the location and zoom level of the map:

  1. In the Outline or Document window, select the Google Map component.
  2. In the Property Inspector, under Map, edit the Latitude, Longitude, and Zoom properties.

    The maximum zoom level depends on available data for a location and is typically between 18 and 21.

How do I show or hide controls for the user?

How do I show or hide controls for the user?

How do I show or hide controls for the user?
You can enable the user to zoom in or out, and move left, down, right, or up using buttons.

To show or hide map controls:

  1. In the Outline or Document window, select the map.
  2. In the Property Inspector, under Map, edit the Map Controls property.

How do I include a dynamic callout as part of my repeater?

How do I include a dynamic callout as part of my repeater?

How do I include a dynamic callout as part of my repeater?
Your repeated map marker can include a callout. To create this effect, you create a callout symbol and make some changes to the marker symbol and the table.


A map repeater with a dynamic callout. When the user mouses over the marker, the callout appears.

First, create a Google Map with a repeater as described above.

To add a mouse-over callout to the repeater:

  1. Create a new symbol to be used as the callout.
  2. For the callout symbol, create a parameter for each property that you want to be dynamic, and bind them to the appropriate properties. See Symbol.
  3. Edit the marker symbol:
    1. In the Symbols panel, right-click the marker symbol and select Edit.
    2. In the Outline, make sure the symbol node is selected.
    3. In the Menu Bar, select Modify > Edit Properties, and create a parameter for each dynamic property of the callout symbol that you defined in step 2. Make sure the data types are the same.
    4. Close the Symbol Parameters dialog, and click Apply in the symbol editing dialog to apply changes and continue editing.
    5. At the bottom of the Property Inspector, under Callout, select Mouse-Over.
    6. For the Symbol property, type the name of the callout symbol.
    7. Click Apply in the symbol editing dialog.

      The callout now appears when the user mouses over a marker. This happens in Preview Mode but not Edit Mode.

  4. Click OK in the symbol editing dialog to apply changes and exit the symbol editing mode.
  5. In the map's dataflow, make sure that the table includes a column for each callout symbol parameter. See Working with Tables.
  6. Bind the table data to the renderer:
    1. Open the dataflow table for the map component.
    2. In the Outline, select the "renderer" node that is a child of the map.
    3. Bind the relevant table column to the relevant parameter in the Property Inspector.
  7. Bind the marker symbol parameters to its callout properties:
    1. In the Symbols panel, right-click the marker symbol, and select Edit.
    2. In the Menu Bar, select Modify > Edit Properties.
    3. In the Outline, expand the symbol, and select the "callout" node that is a child of the symbol.
    4. Bind the relevant symbol parameter to the relevant property in the Property Inspector.

How do I use the Google Maps API with DGLux5?

How do I use the Google Maps API with DGLux5?

How do I use the Google Maps API with DGLux5?
To use the Google Maps API, include a JavaScript block in the dataflow for the map component. See the JavaScript block page for an example.


Google Map Properties

These properties affect the Google Map component.

For a guide to using the Google Map component, see Google Map.

Google Map components are also affected by Common Properties.

Google Map properties
Google Map properties in the Property Inspector

These properties affect the map:

API Key

API Key

API Key
Specifies the Google Maps API key to use.

You are responsible for the use of Google Maps and for compliance with Google's licensing. For details, please see Google's Terms of Service for Google Maps and Google Earth.

The API Key property

Map Type

Map Type

Map Type
Defines the type of Google Map to be displayed in the component.

Roadmap
The default road map view.

Satellite
Google Earth satellite images.

Hybrid
A mixture of road map and satellite images.

Terrain
A physical map based on terrain data.

The Map Type property

Latitude

Latitude

Latitude
Sets or returns the latitude at the center of the map component.

The Latitude property

Longitude

Longitude

Longitude
Sets or returns the longitude at the center of the map component.

The Longitude property

Zoom

Zoom

Zoom
Sets or returns the zoom level for the map. Zero is the lowest zoom level, in which the entire world can be seen in one map. For each map type, valid zoom levels are from 0 to the maximum zoom level for that location and map type. The maximum depends on available data and is typically between 18 and 21 for a given location and map type.

The Zoom property
The Zoom property

Map Controls

Map Controls

Map Controls
Specifies whether to show map controls, allowing the user to manipulate the map. Controls allow the user to zoom in or out, and move left, right, down, or up.

The Map Controls property

Traffic

Traffic

Traffic
Specifies whether to show the Google Maps Traffic Layer on the map.

The Traffic property

These properties affect the map repeater:

Symbol

Symbol

Symbol
Defines the symbol to be used as a location marker. If the symbol is in this project, enter the name of the symbol. To use a symbol from another project in your library, enter the path to that symbol.

The Symbol property
The Symbol property

Data

Data

Data
Defines the table from which latitude and longitude data for location markers can be determined. By default, Google Map has a table case block that you can play with.

The Data property
The Data property

To use the default table:

  1. In the Outline, double-click the dataflow icon of your Google Map component.
  2. Select the table case block in dataflow so you can see the properties.
  3. Hover over the table button until a blue dot appears. Then, click the blue dot and drag it over to the Data property.

|

Latitude Field, Longitude Field

Latitude Field, Longitude Field

Latitude Field, Longitude Field
Define the columns in your table that contain latitude and longitude data.

To use the latitude and longitude columns from the default table, enter latitude and longitude.

The Latitude Field and Longitude Field properties

The following properties affect the map group. A map group is useful when you want to have multiple repeaters, or other components, in your map, or when you want your markers to be placed at each set of coordinates without being centered on the location.

Symbol

Symbol

Symbol
Defines the symbol to be used as a location marker in this map group. If the symbol is in this project, enter the name of the symbol. To use a symbol from another project in your library, enter the path to that symbol.

2019/07/17 19:17