Symbol Profiler
| Block Group: | Logic |
| Icon: | no icon |
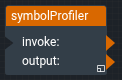
The Symbol Profiler block analyzes the dataflow that contains it and reports how many objects, dataflow symbols, repeaters and tables it holds. It is a debugging tool that helps you find the parts of a page or symbol that use the most resources, such as repeaters with many instances or large tables.
The block analyzes its parent and everything inside it, including the content of dataflow symbols and every instance created by Repeater blocks.
For information on using dataflow blocks, see Dataflow.
Input/Output Properties
The following property of the Symbol Profiler block can take input and give output.
- invoke (trigger)
invoke runs the analysis and updates output.
Output Properties
The following property of the Symbol Profiler block can give output but cannot take input.
- output (string)
output returns the result of the analysis as a formatted JSON string. The result contains these totals:
- totalObject – the number of objects (blocks, components and child objects) analyzed.
- totalSymbol – the number of dataflow symbols.
- totalRepeater – the number of Repeater blocks.
- totalRepeaterChildren – the total number of symbol instances (renderers) created by Repeater blocks.
- totalRepeaterQueue – the total number of rows waiting in Repeater queues.
- totalTable – the number of tables.
- totalTableRows – the total number of rows in those tables.
The result also contains a tree that follows the structure of the dataflow, keyed by property name. In this tree, > renderer and > queue give the instance count and queue size of a repeater, > children holds the analysis of the repeater instances (with > count), > content holds the content of a dataflow symbol, and > table rows gives the number of rows in a table.